| | | | | | | | |
| | |
| Q4 2021 SUPPLEMENTAL INFORMATION |
| | | | | |
| Orion Supplemental Information | |
December 31, 2021 | |
| | | | | |
| Section | Page |
| |
| Company Overview | |
| Balance Sheet | |
| Statements of Operations | |
| |
| Funds From Operations (FFO), Core Funds From Operations (Core FFO) and Funds Available for Distribution (FAD) | |
| EBITDA, EBITDAre and Adjusted EBITDA | |
| Capital Structure | |
| Debt Detail | |
| Ratio Analysis | |
| Credit Facility Covenants | |
| Net Operating Income | |
| Acquisitions | |
| Diversification Statistics | |
| Top 10 Concentrations | |
| Tenants Comprising Over 1% of Annualized Base Rent | |
| Tenant Industry Diversification | |
| Property Geographic Diversification | |
| Lease Expirations | |
| Lease Summary | |
| Unconsolidated Joint Venture Investment Summary | |
| Definitions | |
Orion Office REIT Inc. | WWW.ONLREIT.COM | 2
| | | | | | | | |
| | |
| Q4 2021 SUPPLEMENTAL INFORMATION |
This data and other information described herein are as of and for the three months ended December 31, 2021, unless otherwise indicated. Future performance may not be consistent with past performance and is subject to change and inherent risks and uncertainties. This information should be read in conjunction with the financial statements and the Management's Discussion and Analysis of Financial Condition and Results of Operations sections contained in Orion Office REIT Inc.'s (the "Company," "Orion," "us," "our" and "we") Annual Report on Form 10-K for the year ended December 31, 2021 and Quarterly Report on Form 10-Q for the quarter ended September 30, 2021.
In compliance with the applicable GAAP requirements, results for the three months ended December 31, 2021 include the results of operations of only the Company’s office properties formerly owned by Realty Income for the period from October 1 to October 31, and all of the Company’s properties for the period from November 1 to December 31. Because the Company’s results do not include all of the Company’s operating properties for the entirety of the three months ended December 31, 2021, we have included in this presentation, on a supplemental basis, certain results of operations of the entire portfolio for the two-month period from November 1, 2021 to December 31, 2021. In addition, we also include in this presentation, non-GAAP pro forma financial information for the two-month period from November 1, 2021 to December 31, 2021, which adjusts the results of operations from that period for certain non-recurring items, such as impairment charges, acquisition fees related to our unconsolidated joint venture, transaction costs related to our spin-off from Realty Income and lease termination income. We believe presentation of the Company’s pro forma results of operations is helpful supplemental information because they exclude the effects of certain infrequent or non-recurring items which can create significant earnings volatility, but which do not directly relate to our core recurring business operations. As a result, we believe the pro forma results can help facilitate comparison of operating performance between periods. Other REITs may not report pro forma results or define pro forma results in the same manner as us; therefore our computation of pro forma results may not be comparable to other REITs.
Orion Office REIT Inc. | WWW.ONLREIT.COM | 3
| | | | | | | | |
| | |
| Q4 2021 SUPPLEMENTAL INFORMATION |
| | |
|
| Forward-Looking Statements |
|
Information set forth herein contains “forward-looking statements” which reflect the Company's expectations and projections regarding future events and plans, the Company's future financial condition, results of operations, liquidity and business, including leasing and occupancy, acquisitions, dispositions, rent receipts, the payment of future dividends, the Company’s future growth and the impact of the coronavirus (COVID-19) on the Company's business. Generally, the words "anticipates," "assumes," "believes," "continues," "could," "estimates," "expects," "goals," "intends," "may," "plans," "projects," "seeks," "should," "targets," "will," "guidance", variations of such words and similar expressions identify forward-looking statements. These forward-looking statements are based on information currently available to the Company and involve a number of known and unknown assumptions and risks, uncertainties and other factors, which may be difficult to predict and beyond the Company's control, that could cause actual events and plans or could cause the Company's business, financial condition, liquidity and results of operations to differ materially from those expressed or implied in the forward-looking statements. Further, information regarding historical rent collections should not serve as an indication of future rent collections.
The following factors, among others, could cause actual results to differ materially from those set forth in the forward-looking statements:
•the risk of rising interest rates, including that our borrowing costs may increase and we may be unable to refinance our debt obligations on favorable terms or at all;
•the risk of inflation, including that our operating costs, such as insurance premiums, utilities, real estate taxes and capital expenditures and repair and maintenance costs, may rise;
•conditions associated with the global market, including an oversupply of office space, tenant credit risk and general economic conditions;
•the extent to which the ongoing COVID-19 pandemic or any future pandemic or outbreak of a highly infectious or contagious disease or fear of such pandemics or outbreaks impacts our business, operating results, financial condition and prospects, which is highly uncertain and cannot be predicted with confidence, including the scope, severity and duration of the COVID-19 pandemic and its impact on the U.S. economy and potential changes in tenant behavior that could adversely affect the use of and demand for office space;
•our ability to acquire new properties and sell non-core assets on favorable terms and in a timely manner, or at all;
•our ability to comply with the terms of our credit agreements or to meet the debt obligations on certain of our properties;
•our ability to access the capital markets to raise additional equity or refinance maturing debt on favorable terms or at all;
•changes in the real estate industry and in performance of the financial markets and interest rates and our ability to effectively hedge against interest rate changes;
•the risk of tenant defaults on their lease obligations, which are heightened due to our focus on single tenant properties;
•our ability to renew leases with existing tenants or re-let space to new tenants on favorable terms or at all;
•the cost of rent concessions, tenant improvement allowances and leasing commissions;
•the potential for termination of existing leases pursuant to tenant termination rights;
•the amount, growth and relative inelasticity of our expenses;
•risks associated with the ownership and development of real property;
•risks associated with our joint venture with an affiliate of Arch Street Capital Partners and any potential future equity investments;
•the ability to satisfy conditions necessary to close pending transactions and the ability to successfully integrate pending transactions;
•risks associated with acquisitions, including the integration of the office portfolios of Realty Income Corporation (“Realty Income”) and VEREIT Inc. into Orion;
•Realty Income’s inability or failure to perform under the various transaction agreements effecting the Separation and the Distribution;
•risks associated with the fact that we have a limited operating history and our future performance is difficult to predict;
•our properties may be subject to impairment charges;
Orion Office REIT Inc. | WWW.ONLREIT.COM | 4
| | | | | | | | |
| | |
| Q4 2021 SUPPLEMENTAL INFORMATION |
•risks resulting from losses in excess or insured limits or uninsured losses; and
•risks associated with the potential volatility of our common stock.
Additional factors that may affect future results are contained in the Company's filings with the SEC, which are available at the SEC’s website at www.sec.gov. The Company disclaims any obligation to publicly update or revise any forward-looking statements, whether as a result of changes in underlying assumptions or factors, new information, future events or otherwise, except as required by law.
Orion Office REIT Inc. | WWW.ONLREIT.COM | 5
| | | | | | | | |
| | |
| Q4 2021 SUPPLEMENTAL INFORMATION |
| | |
|
Company Overview (unaudited) |
|
Orion is a real estate company incorporated in the state of Maryland on July 1, 2021, which intends to qualify and elect to be taxed as a real estate investment trust ("REIT") for U.S. federal income tax purposes, commencing with our initial taxable year ended December 31, 2021.
Orion is a full-service real estate operating company which owns and operates a portfolio of 92 office properties totaling approximately 10.5 million leasable square feet located within 29 states and Puerto Rico. In addition, the Company owns a 20% equity interest in one unconsolidated joint venture with an affiliate of Arch Street Capital Partners, which owns a portfolio consisting of six office properties totaling approximately 1.0 million leasable square feet located within six states. As of December 31, 2021, approximately 67.7% of the Company's Annualized Base Rent was from Investment Grade Tenants, the Company's Occupancy Rate was 91.9% and the Weighted Average Remaining Lease Term was 4.1 years.
The Company's Annualized Base Rent as of December 31, 2021 was approximately $179.8 million. However, as a result of two scheduled lease expirations that occurred on January 1, 2022, the Company's Annualized Base Rent declined by 4% to $172.6 million as of January 1, 2022. See "Top Ten Concentrations" and "Tenants Comprising Over 1% of Annualized Base Rent" below.
During the three months ended December 31, 2021 our rent collection was approximately 99% of base rent and reimbursements.
Tenants, Trademarks and Logos
Orion is not affiliated or associated with, is not endorsed by, does not endorse, and is not sponsored by or a sponsor of the tenants or of their products or services pictured or mentioned. The names, logos and all related product and service names, design marks and slogans are the trademarks or service marks of their respective companies.
See the Definitions section for a description of the Company's non-GAAP and operating metrics.
Orion Office REIT Inc. | WWW.ONLREIT.COM | 6
| | | | | | | | |
| | |
| Q4 2021 SUPPLEMENTAL INFORMATION |
| | | | | | | | |
| Senior Management | | Board of Directors |
| | |
| Paul H. McDowell, Chief Executive Officer, President | | Reginald H. Gilyard, Non-Executive Chairman |
| | |
| Gavin B. Brandon, Executive Vice President, Chief Financial Officer and Treasurer | | Kathleen R. Allen, Ph.D., Independent Director |
| | |
| Paul C. Hughes, General Counsel and Secretary | | Richard J. Lieb, Independent Director |
| | |
| Christopher H. Day, Executive Vice President, Chief Operating Officer | | Gregory J. Whyte, Independent Director |
| | |
| Gary E. Landriau, Executive Vice President, Chief Investment Officer | | Paul H. McDowell, Chief Executive Officer and Director |
| | |
| Revea L. Schmidt, Senior Vice President, Chief Accounting Officer | | |
Corporate Offices and Contact Information
| | | | | | | | |
| 2325 E. Camelback Road, Suite 850 | | 19 West 44th Street, Suite 1401 |
| Phoenix, AZ 85016 | | New York, NY 10036 |
| 602-698-1002 | | |
| www.ONLREIT.com | | |
Trading Symbol: ONL
Stock Exchange Listing: New York Stock Exchange
Transfer Agent
Computershare Trust Company, N.A.
462 South 4th Street, Suite 1600
Louisville, KY 40202
855-866- 0787
Orion Office REIT Inc. | WWW.ONLREIT.COM | 7
| | | | | | | | |
| | |
| Q4 2021 SUPPLEMENTAL INFORMATION |
| | |
|
Balance Sheet (unaudited, in thousands) |
|
| | | | | | | | |
| | December 31, 2021 |
| Assets | | |
| Real estate investments, at cost: | | |
| Land | | $ | 250,194 | |
| Buildings, fixtures and improvements | | 1,231,551 | |
| Total real estate investments, at cost | | 1,481,745 | |
| Less: accumulated depreciation and amortization | | 128,109 | |
| Total real estate investments, net | | 1,353,636 | |
| Accounts receivable, net | | 17,916 | |
| Intangible lease assets, net | | 298,107 | |
| Cash and cash equivalents | | 29,318 | |
| Other assets, net | | 60,501 | |
| | |
| Total assets | | $ | 1,759,478 | |
| | |
| | |
| Liabilities and Equity | | |
| Bridge facility, net | | $ | 354,357 | |
| Credit facility term loan, net | | 172,490 | |
| Credit facility revolver | | 90,000 | |
| | |
| Accounts payable and accrued expenses | | 17,379 | |
| Below-market lease liabilities, net | | 20,609 | |
| | |
| Other liabilities, net | | 16,355 | |
| Total liabilities | | 671,190 | |
| | |
| | |
| Common stock | | 57 | |
| Additional paid-in capital | | 1,145,278 | |
| Accumulated other comprehensive income (loss) | | 299 | |
| Accumulated deficit | | (58,715) | |
| Total stockholders' equity | | 1,086,919 | |
| Non-controlling interests | | 1,369 | |
| Total equity | | 1,088,288 | |
| Total liabilities and equity | | $ | 1,759,478 | |
Orion Office REIT Inc. | WWW.ONLREIT.COM | 8
| | | | | | | | |
| | |
| Q4 2021 SUPPLEMENTAL INFORMATION |
| | |
|
Statements of Operations (unaudited, in thousands, except per share data) |
|
| | | | | | | | | | | | | | | | | | | | | | | | | | |
| | Quarter Ended December 31, 2021 (1) | | November 1, 2021 to December 31, 2021 (2) | | Pro Forma Adjustments (3) | | November 1, 2021 to December 31, 2021 (Pro Forma) (4) |
| Revenues: | | | | | | | | |
| Rental | | $ | 40,530 | | | $ | 36,648 | | | $ | (270) | | | $ | 36,378 | |
| Fee income from unconsolidated joint venture | | 271 | | | 271 | | | (183) | | | 88 | |
| Total revenues | | 40,801 | | | 36,919 | | | (453) | | | 36,466 | |
| Operating expenses: | | | | | | | | |
| | | | | | | | |
| Transaction costs | | 5,112 | | | 5,112 | | | (5,112) | | | — | |
| Property operating | | 8,801 | | | 8,367 | | | — | | | 8,367 | |
| General and administrative | | 2,167 | | | 1,999 | | | — | | | 1,999 | |
| Depreciation and amortization | | 26,067 | | | 24,083 | | | — | | | 24,083 | |
| Impairments | | 49,859 | | | 49,859 | | | (49,859) | | | — | |
| Total operating expenses | | 92,006 | | | 89,420 | | | (54,971) | | | 34,449 | |
| Other (expense) income: | | | | | | | | |
| Interest expense | | (3,187) | | | (3,187) | | | — | | | (3,187) | |
| (Loss) gain on extinguishment and forgiveness of debt, net | | (283) | | | — | | | — | | | — | |
| | | | | | | | |
| | | | | | | | |
| Equity in income of unconsolidated joint venture | | (56) | | | (56) | | | — | | | (56) | |
| | | | | | | | |
| Total other (expenses) income, net | | (3,526) | | | (3,243) | | | — | | | (3,243) | |
| (Loss) income before taxes | | (54,731) | | | (55,744) | | | 54,518 | | | (1,226) | |
| Provision for income taxes | | (157) | | | (157) | | | — | | | (157) | |
| Net (loss) income | | (54,888) | | | (55,901) | | | 54,518 | | | (1,383) | |
| Net (income) loss attributable to non-controlling interest | | (17) | | | (17) | | | — | | | (17) | |
| Net (loss) income attributable to common stockholders | | $ | (54,905) | | | $ | (55,918) | | | $ | 54,518 | | | $ | (1,400) | |
| | | | | | | | |
| Weighted-average shares outstanding - basic and diluted | | 56,626 | | | 56,626 | | | 56,626 | | | 56,626 | |
| Basic and diluted net (loss) income per share attributable to common stockholders | | $ | (0.97) | | | $ | (0.99) | | | $ | 0.96 | | | $ | (0.02) | |
(1) Represents results of operations in accordance with GAAP and includes only the Company's office properties formerly owned by Realty Income for the period from October 1 to
October 31 and all of the Company's properties for the period from November 1 to December 31.
(2) Represents results of operations for all of the Company's properties for the period from November 1 to December 31, on a non-GAAP basis, excluding results of the Company's office
properties formerly owned by Realty Income for the period from October 1 to October 31.
(3) Adjustments include lease termination income ($270K), acquisition fees related to the Arch Street Unconsolidated Joint Venture ($183K), transaction costs related to the spin-off
from Realty Income ($5.1M) and impairments ($49.9M).
(4) Represents results of operations for all of the Company’s properties for the period from November 1 to December 31, on a non-GAAP basis, excluding results of the Company’s office
properties formerly owned by Realty Income for the period from October 1 to October 31, and as adjusted for certain non-recurring items, such as impairment charges, joint venture
acquisition fee, transaction costs related to the Company’s spin-off transaction from Realty Income and lease termination income. We believe presentation of the Company’s pro
forma results of operations is helpful supplemental information because it includes results for all of the Company’s properties for the full period presented and excludes the effects
of certain infrequent or non-recurring items which can create significant earnings volatility, but which do not directly relate to the Company’s core recurring business operations. As
a result, we believe that the Company’s pro forma results can help facilitate comparisons of operating performance between periods. Other REITs may not report pro forma results or
define pro forma results in the same manner as us; therefore our computation of pro forma results may not be comparable to other REITs.
Orion Office REIT Inc. | WWW.ONLREIT.COM | 9
| | | | | | | | |
| | |
| Q4 2021 SUPPLEMENTAL INFORMATION |
| | |
|
Funds From Operations (FFO), Core Funds From Operations (Core FFO) and Funds Available for Distribution (FAD) (unaudited, in thousands, except share and per share data) |
|
| | | | | | | | | | | | | | | | | | | | | | | | | | |
| | Quarter Ended December 31, 2021 | | November 1, 2021 to December 31, 2021 | | Pro Forma Adjustments (1) | | November 1, 2021 to
December 31, 2021
(Pro Forma) |
| Net (loss) income | | $ | (54,905) | | | $ | (55,918) | | | $ | 54,518 | | | $ | (1,400) | |
| Depreciation and amortization of real estate assets | | 26,060 | | | 24,076 | | | — | | | 24,076 | |
| Impairment of real estate | | 49,859 | | | 49,859 | | | (49,859) | | | — | |
| Proportionate share of Unconsolidated Joint Venture adjustments for items above, as applicable | | 397 | | | 397 | | | — | | | 397 | |
| FFO attributable to common stockholders | | $ | 21,411 | | | $ | 18,414 | | | $ | 4,659 | | | $ | 23,073 | |
| Adjustments: | | | | | | | | |
| | | | | | | | |
| Transaction costs | | 5,112 | | | 5,112 | | | (5,112) | | | — | |
| Loss on extinguishment of debt, net | | 283 | | | — | | | — | | | — | |
| | | | | | | | |
| Core funds from operations attributable to common stockholders | | $ | 26,806 | | | $ | 23,526 | | | $ | (453) | | | $ | 23,073 | |
| Adjustments: | | | | | | | | |
| Amortization of deferred financing costs | | 729 | | | 729 | | | — | | | 729 | |
| | | | | | | | |
| | | | | | | | |
| Amortization of above and below market leases and deferred lease incentives, net of amortization of below-market lease liabilities | | (295) | | | (213) | | | — | | | (213) | |
| | | | | | | | |
| Straight-line rental revenue | | (575) | | | (638) | | | — | | | (638) | |
| Equity-Based Compensation | | 180 | | | 180 | | | — | | | 180 | |
| Equity in income of Unconsolidated Joint Venture | | 56 | | | 56 | | | — | | | 56 | |
| Capital expenditures | | (9,933) | | | (9,933) | | | — | | | (9,933) | |
| Other adjustments, net | | 96 | | | 95 | | | — | | | 95 | |
| Proportionate share of Unconsolidated Joint Venture adjustments for the items above, as applicable | | (3) | | | (3) | | | — | | | (3) | |
| Funds available for distribution | | $ | 17,061 | | | $ | 13,799 | | | $ | (453) | | | $ | 13,346 | |
| | | | | | | | |
| Weighted-average shares outstanding - basic and diluted | | 56,626 | | | 56,626 | | | 56,626 | | | 56,626 | |
| | | | | | | | |
| | | | | | | | |
| | | | | | | | |
FFO attributable to common stockholders per share | | $ | 0.38 | | | $ | 0.33 | | | $ | 0.08 | | | $ | 0.41 | |
| Core FFO attributable to common stockholders per share | | $ | 0.47 | | | $ | 0.42 | | | $ | (0.01) | | | $ | 0.41 | |
| FAD per share | | $ | 0.30 | | | $ | 0.24 | | | $ | (0.01) | | | $ | 0.24 | |
___________________________________
(1) Adjustments include lease termination income ($270k), acquisition fees related to the Arch Street Unconsolidated Joint Venture ($183k), transaction costs related to
the spin-off from Realty Income ($5.1M) and impairments ($49.9M).
(2) Refer to the Statements of Operations section for basic and diluted net income (loss) per share attributable to common stockholders.
See the Definitions section for a description of the Company's non-GAAP and operating metrics.
Orion Office REIT Inc. | WWW.ONLREIT.COM | 10
| | | | | | | | |
| | |
| Q4 2021 SUPPLEMENTAL INFORMATION |
| | |
|
EBITDA, EBITDAre and Adjusted EBITDA (unaudited, in thousands) |
|
| | | | | | | | | | | | | | | | | | | | | | | | | | |
| | Quarter Ended
December 31, 2021 | | November 1, 2021 to December 31, 2021 | | Pro Forma Adjustments (1) | | November 1, 2021 to December 31, 2021
(Pro Forma) |
| Net (loss) income | | $ | (54,905) | | | $ | (55,918) | | | $ | 54,518 | | | $ | (1,400) | |
| Adjustments: | | | | | | | | |
| Interest expense | | 3,187 | | | 3,187 | | | — | | | 3,187 | |
| Depreciation and amortization | | 26,067 | | | 24,083 | | | — | | | 24,083 | |
| Provision for income taxes | | 157 | | | 157 | | | — | | | 157 | |
| Proportionate share of Unconsolidated Joint Venture adjustments for items above, as applicable | | 501 | | | 501 | | | — | | | 501 | |
| EBITDA | | $ | (24,993) | | | $ | (27,990) | | | $ | 54,518 | | | $ | 26,528 | |
| | | | | | | | |
| Impairment of real estate | | 49,859 | | | 49,859 | | | (49,859) | | | — | |
| | | | | | | | |
| EBITDAre | | $ | 24,866 | | | $ | 21,869 | | | $ | 4,659 | | | $ | 26,528 | |
| | | | | | | | |
| | | | | | | | |
| Transaction costs | | 5,112 | | | 5,112 | | | (5,112) | | | — | |
| | | | | | | | |
| Amortization of above-market lease assets and deferred lease incentives, net of amortization of below-market lease liabilities | | (295) | | | (213) | | | — | | | (213) | |
| (Gain) loss on extinguishment and forgiveness of debt, net | | 283 | | | — | | | — | | | — | |
| | | | | | | | |
| Proportionate share of Unconsolidated Joint Venture adjustments for items above, as applicable | | (1) | | | (1) | | | — | | | (1) | |
| Adjusted EBITDA | | $ | 29,965 | | | $ | 26,767 | | | $ | (453) | | | $ | 26,314 | |
(1) Adjustments include lease termination income ($270k), acquisition fees related to the Arch Street Unconsolidated Joint Venture ($183k), transaction costs related to the spin-off from
Realty Income ($5.1M) and impairments ($49.9M).
See the Definitions section for a description of the Company's non-GAAP and operating metrics.
Orion Office REIT Inc. | WWW.ONLREIT.COM | 11
| | | | | | | | |
| | |
| Q4 2021 SUPPLEMENTAL INFORMATION |
| | |
|
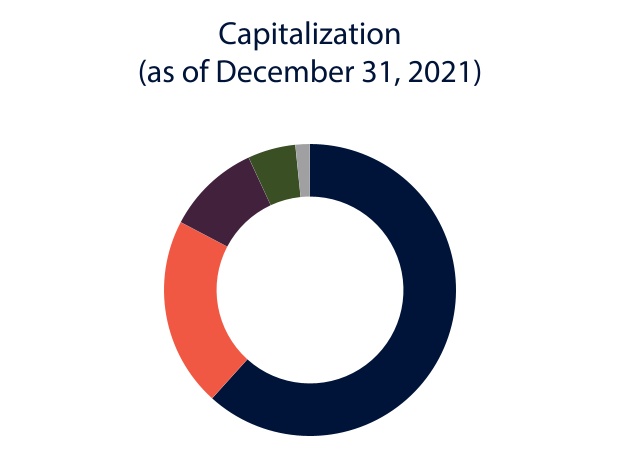
Capital Structure (unaudited, dollars and shares in thousands, except per share amounts) |
|
| | | | | | | | | | | |
| | Common equity | 62.0% |
| | | |
| | Bridge facility (3) | 20.8% |
| | | |
| | Credit facility term loan | 10.3% |
| | | |
| | Credit facility revolver | 5.3% |
| | | |
| | Proportionate share of Unconsolidated Joint Venture Debt | 1.6% |
Fixed vs. Variable Rate Debt (3)
| | | | | |
| |
| Swapped to Fixed | 27.0 | % |
| Variable | 73.0 | % |
| | | | | | | | | | | | | | | | | |
| Orion Capitalization Table | | |
| | | | | December 31, 2021 |
| Diluted shares outstanding | | | | 56,626 |
| Stock price | | | | | $ | 18.67 |
| Implied Equity Market Capitalization | | $ | 1,057,207 |
| | | | | |
| Wtd. Avg. Maturity
(Years) | | Interest Rate (1) | | December 31, 2021 |
| Proportionate share of Unconsolidated Joint Venture Debt | 1.0 | | 1.65 | % | | 27,332 |
| Total secured debt | 1.0 | | 1.65 | % | | $ | 27,332 |
| | | | | |
Bridge facility (2) (3) | 0.4 | | 2.60 | % | | 355,000 |
Credit facility term loan (4) | 1.9 | | 3.19 | % | | 175,000 |
Credit facility revolver (2) | 2.9 | | 2.60 | % | | 90,000 |
| Total unsecured debt | 1.2 | | 2.77 | % | | 620,000 |
| | | | | |
Total Principal Outstanding (3) | 1.1 | | 2.72 | % | | $ | 647,332 |
| | | | | |
| Total Capitalization | | $ | 1,704,539 |
| Cash and cash equivalents | | 29,318 |
| Proportionate share of Unconsolidated Joint Ventures' cash and cash equivalents | | 590 |
| Enterprise Value | | $ | 1,674,631 |
| | |
| Net Debt/Enterprise Value | | 36.9 | % |
| Net Debt/Adjusted EBITDA Annualized | | N/A |
| Fixed Charge Coverage Ratio | | 17.18x |
Liquidity (5) | | $ | 364,908 |
___________________________________
(1)Weighted average interest rate for variable rate debt represents the interest rate in effect as of December 31, 2021.
(2)Under the related loan agreements, these borrowings which are secured only by a pledge of equity interests are treated as unsecured indebtedness.
(3)On February 10, 2022, the $355 million Bridge facility was repaid in full and replaced by a $355 million mortgage loan at a fixed rate of 4.97%. The mortgage loan matures on February 11, 2027. Had the CMBS bridge facility been replaced by this mortgage loan as of December 31, 2021, the Company's weighted-average interest rate would have been approximately 4.02%, its weighted-average maturity would have been approximately 3.8 years and its interest rate mix would have been approximately 54.9% fixed rate, 27.0% swapped to fixed rate and 18.1% variable rate debt.
(4)The term loan is a floating rate facility, however, the Company has entered into an interest rate swap transaction which effectively fixes the interest rate on the term loan indebtedness at 3.19% per annum.
(5)Liquidity represents cash and cash equivalents of $29.7 million and approximately $335 million available capacity on our $425 million revolving credit facility as of December 31, 2021.
See the Definitions section for a description of the Company's non-GAAP and operating metrics.
Orion Office REIT Inc. | WWW.ONLREIT.COM | 12
| | | | | | | | |
| | |
| Q4 2021 SUPPLEMENTAL INFORMATION |
| | |
|
Debt Detail (unaudited, dollars in thousands) |
|
| | | | | | | | | | | | | | | | | | | | | | | | | | | | |
| Principal Payments Due | | Total | | 2022 | | 2023 | | 2024 | | |
| Credit facility revolver | | $ | 90,000 | | | $ | — | | | $ | — | | | $ | 90,000 | | | |
| Credit facility term loan | | 175,000 | | | — | | | 175,000 | | | — | | | |
CMBS bridge facility (1) | | 355,000 | | | 355,000 | | | — | | | — | | | |
| Proportionate share of Unconsolidated Joint Venture debt | | 27,332 | | | — | | | 27,332 | | | — | | | |
| Total Principal Outstanding | | $ | 647,332 | | | $ | 355,000 | | | $ | 202,332 | | | $ | 90,000 | | | |
| | | | | | | | | | |
| | | | | | | | | | | | | | | | | | | | |
| Debt Type | | Percentage of Principal Outstanding | | Interest Rate | | Weighted-Average Years to Maturity |
| Credit facility revolver | | 13.9 | % | | 2.60 | % | | 2.9 | |
| Credit facility term loan | | 27.0 | % | | 3.19 | % | | 1.9 | |
CMBS bridge facility (1) | | 54.9 | % | | 2.60 | % | | 0.4 | |
| Proportionate share of Unconsolidated Joint Venture debt | | 4.2 | % | | 1.65 | % | | 1.0 | |
Total (1) | | 100.0 | % | | 2.72 | % | | 1.1 | |
| | | | | | | | | | | | | | | | | | | | |
| Debt Type | | Percentage of Principal Outstanding | | Weighted-Average Interest Rate | | Weighted-Average Years to Maturity |
| Total unsecured debt | | 95.8 | % | | 2.77 | % | | 1.2 | |
| Total secured debt | | 4.2 | % | | 1.65 | % | | 1.0 | |
Total (1) | | 100.0 | % | | 2.72 | % | | 1.1 | |
| | | | | | |
| Total swapped to fixed-rate debt | | 27.0 | % | | 3.19 | % | | 1.9 | |
| Total variable-rate debt | | 73.0 | % | | 2.54 | % | | 0.9 | |
Total (1) | | 100.0 | % | | 2.72 | % | | 1.1 | |
___________________________________
(1)On February 10, 2022, the CMBS bridge facility was repaid in full and replaced by a $355 million mortgage loan at a fixed rate of 4.97%. The mortgage loan matures on February 11, 2027. Had the CMBS bridge facility been replaced by this mortgage loan as of December 31, 2021, the Company's weighted-average interest rate would have been approximately 4.02%, its weighted-average maturity would have been approximately 3.8 years, its mix of unsecured and secured debt would have been approximately 40.9% unsecured and 59.1% secured and its interest rate mix would have been approximately 54.9% fixed rate, 27.0% swapped to fixed rate and 18.1% variable rate debt.
See the Definitions section for a description of the Company's non-GAAP and operating metrics.
Orion Office REIT Inc. | WWW.ONLREIT.COM | 13
| | | | | | | | |
| | |
| Q4 2021 SUPPLEMENTAL INFORMATION |
| | |
|
Ratio Analysis (unaudited, dollars in thousands) |
|
| | | | | | | | | | | | | | | | | | | | |
| Interest Coverage Ratio | | November 1, 2021 to December 31, 2021 | | Pro Forma Adjustments (1) | | November 1, 2021 to December 31, 2021
(Pro Forma) |
Interest Expense, excluding non-cash amortization (2) | | $ | 2,522 | | $ | — | | $ | 2,522 |
Adjusted EBITDA (3) | | 26,767 | | (453) | | 26,314 |
| Interest Coverage Ratio | | 10.61x | | | | 10.43x |
| | | | | | |
| Fixed Charge Coverage Ratio | | | | | | |
Interest Expense, excluding non-cash amortization (2) | | $ | 2,522 | | $ | — | | $ | 2,522 |
| Secured debt principal amortization | | — | | — | | — |
| Total fixed charges | | 2,522 | | — | | 2,522 |
Adjusted EBITDA (3) | | 26,767 | | (453) | | 26,314 |
| Fixed Charge Coverage Ratio | | 10.61x | | | | 10.43x |
| | | | | | |
| | December 31, 2021 | | | | |
| Net Debt Ratios | | | | | | |
| | | | | | |
| | | | | | |
| | | | | | |
| | | | | | |
Net Debt (4) | | $ | 617,424 | | | | |
Gross Real Estate Investments (4) | | 1,862,127 | | | | |
| Net Debt Leverage Ratio | | 33.2 | % | | | | |
| | | | | | |
Unencumbered Assets/Real Estate Assets (5) | | | | |
Unencumbered Gross Real Estate Investments (4) | | $ | 1,816,726 | | | | |
Gross Real Estate Investments (4) | | 1,862,127 | | | | |
| Unencumbered Asset Ratio | | 97.6 | % | | | | |
___________________________________
(1)Adjustments include lease termination income ($270k), acquisition fees related to the Arch Street Unconsolidated Joint Venture ($183k), transaction costs related to the spin-off from Realty Income ($5.1M) and impairments ($49.9M).
(2)Refer to the Statements of Operations section for interest expense calculated in accordance with GAAP and to the Definitions section for the required reconciliation to the most directly comparable GAAP financial measure.
(3)Refer to the Statements of Operations section for net income calculated in accordance with GAAP and to the EBITDAre and Adjusted EBITDA section for the required reconciliation to the most directly comparable GAAP financial measure.
(4)Refer to the Balance Sheet section for total debt and real estate investments, at cost calculated in accordance with GAAP and to the Definitions section for the required reconciliation to the most directly comparable GAAP financial measure.
(5)On February 10, 2022, the CMBS bridge facility was repaid in full and replaced by a $355 million mortgage loan at a fixed rate of 4.97%. The loan matures on February 11, 2027. Had the CMBS bridge facility been replaced by this mortgage loan as of December 31, 2021, the Company's Unencumbered Gross Real Estate Investments would have been approximately $1,262,031 and its Unencumbered Asset Ratio would have been approximately 67.8%.
See the Definitions section for a description of the Company's non-GAAP and operating metrics.
Orion Office REIT Inc. | WWW.ONLREIT.COM | 14
| | | | | | | | |
| | |
| Q4 2021 SUPPLEMENTAL INFORMATION |
| | |
|
Credit Facility Covenants (unaudited) |
|
The following is a summary of key financial covenants for the Company's term loan and revolving credit facility as defined and calculated per the terms of the facility's credit agreement. These calculations, which are not based on GAAP measurements, are presented to investors to show the Company's compliance with the financial covenants and are not measures of our liquidity or performance. As of December 31, 2021, the Company believes it is in compliance with these covenants based on the covenant limits and calculations in place at that time.
| | | | | | | | | | | | | | | |
| Credit Facility Key Covenants | | Required | | December 31, 2021 | |
| | | | | |
| Ratio of total indebtedness to total asset value | | ≤ 60% | | 30.8% | |
| Ratio of adjusted EBITDA to fixed charges | | ≥ 1.5x | | 10.07x | |
| Ratio of secured indebtedness to total asset value | | ≤ 45% | | 1.3% | |
| Ratio of unsecured indebtedness to unencumbered asset value | | ≤ 60% | | 30.5% | |
| Ratio of unencumbered adjusted NOI to unsecured interest expense | | ≥ 2.00x | | 16.55x | |
| | | | | |
See the Definitions section for a description of the Company's non-GAAP and operating metrics.
Orion Office REIT Inc. | WWW.ONLREIT.COM | 15
| | | | | | | | |
| | |
| Q4 2021 SUPPLEMENTAL INFORMATION |
| | |
|
Net Operating Income (unaudited, dollars in thousands) |
|
NOI and Cash NOI
| | | | | | | | | | | | | | | | | | | | | | | | | | |
| | Quarter Ended
December 31, 2021 | | November 1, 2021 to December 31, 2021 | | Pro Forma Adjustments (1) | | November 1, 2021 to December 31, 2021
(Pro Forma) |
Rental revenue (1) | | $ | 40,530 | | | $ | 36,648 | | | $ | (270) | | | $ | 36,378 | |
| Property operating expense | | (8,801) | | | (8,367) | | | — | | | (8,367) | |
| NOI | | 31,729 | | | 28,281 | | | (270) | | | 28,011 | |
| Adjustments: | | | | | | | | |
| Straight-line rent | | (575) | | | (638) | | | — | | | (638) | |
| Amortization of above-market lease assets and deferred lease incentives, net of amortization of below-market lease liabilities | | (295) | | | (213) | | | — | | | (213) | |
| Other non-cash adjustments | | 74 | | | 73 | | | — | | | 73 | |
| Proportionate share of Unconsolidated Joint Venture NOI | | 474 | | | 474 | | | — | | | 474 | |
| Cash NOI | | $ | 31,407 | | | $ | 27,977 | | | $ | (270) | | | $ | 27,707 | |
___________________________________
(1) Adjustments include lease termination income ($270k).
See the Definitions section for a description of the Company's non-GAAP and operating metrics.
Orion Office REIT Inc. | WWW.ONLREIT.COM | 16
| | | | | | | | |
| | |
| Q4 2021 SUPPLEMENTAL INFORMATION |
| | |
|
Acquisitions (unaudited, square feet and dollars in thousands) |
|
Acquisitions
The following table summarizes the Company's acquisition activity during the three months ended December 31, 2021.
| | | | | | | | | | | | | | | | | | | | | | | | | | | | | | | | |
| | Number of Properties | | Square Feet | | Remaining Lease Term (Years) (1) | | Cash Cap Rate | | Purchase Price (2) |
Spire Energy - St. Louis, MO (3) | | 1 | | 127 | | | 13.2 | | | 6.5 | % | | $ | 30,500 | |
| Total | | 1 | | 127 | | | | | | | $ | 30,500 | |
___________________________________
(1)Represents the remaining lease term from the date of acquisition.
(2)Excludes acquisition-related expenses capitalized.
(3)Arch Street Unconsolidated Joint Venture acquisition in which the Company owns a 20% equity interest.
See the Definitions section for a description of the Company's non-GAAP and operating metrics.
Orion Office REIT Inc. | WWW.ONLREIT.COM | 17
| | | | | | | | |
| | |
| Q4 2021 SUPPLEMENTAL INFORMATION |
| | |
|
Diversification Statistics: Real Estate Portfolio (unaudited, percentages based on portfolio Annualized Base Rent as of December 31, 2021) |
|
___________________________________________________
___________________________________________________
___________________________________________________
___________________________________________________
| | | | | | | | |
Statistics (square feet in thousands) |
| | |
| Operating Properties | | 92 | |
| Unconsolidated Joint Venture Properties | | 6 | |
| Rentable Square Feet | | 10,646 | |
| Occupancy Rate | | 91.9 | % |
| Weighted Average Remaining Lease Term | | 4.1 | |
| Investment-Grade Tenants | | 67.7 | % |
| | |
| NN leases | | 65.3 | % |
| NNN leases | | 16.8 | % |
See the Definitions section for a description of the Company's non-GAAP and operating metrics.
Orion Office REIT Inc. | WWW.ONLREIT.COM | 18
| | | | | | | | |
| | |
| Q4 2021 SUPPLEMENTAL INFORMATION |
| | |
|
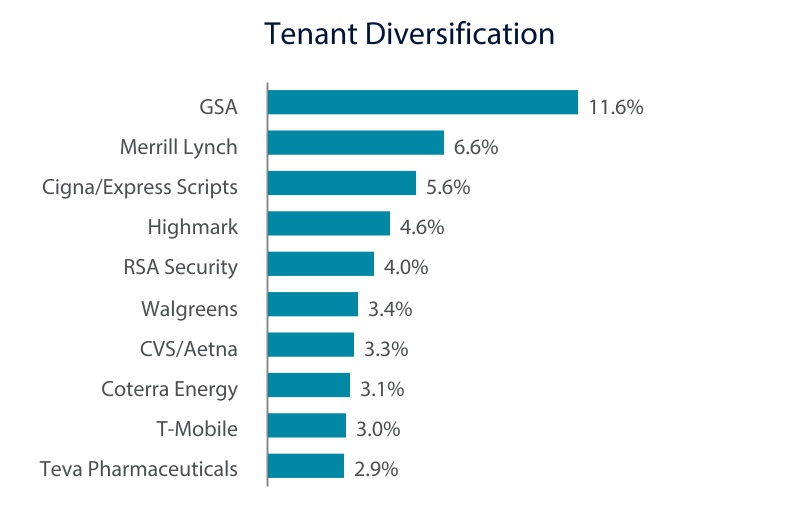
Top 10 Concentrations: Real Estate Portfolio (unaudited, square feet and dollars in thousands as of December 31, 2021) |
|
| | | | | | | | | | | | | | | | | | | | | | | | | | | | | | | | | | | | | | |
| Tenant Concentration | | Number of Leases | | Leased Square Feet | | Square Feet as a % of Total Portfolio | | Annualized Base Rent | | Annualized Base Rent as a % of Total Portfolio | | Credit Rating |
| General Service Administration | | 18 | | | 845 | | | 7.9 | % | | $ | 20,845 | | | 11.6 | % | | AA+ |
| Merrill Lynch | | 1 | | | 482 | | | 4.5 | % | | 11,805 | | | 6.6 | % | | A- |
Cigna/Express Scripts (1) | | 4 | | | 592 | | | 5.6 | % | | 10,109 | | | 5.6 | % | | A- |
| Highmark Western & Northeastern NY | | 1 | | | 430 | | | 4.0 | % | | 8,208 | | | 4.6 | % | | NR |
| RSA Security | | 2 | | | 328 | | | 3.1 | % | | 7,221 | | | 4.0 | % | | BBB |
| Walgreens | | 6 | | | 574 | | | 5.4 | % | | 6,201 | | | 3.4 | % | | BBB |
CVS/Aetna (1) | | 2 | | | 322 | | | 3.0 | % | | 5,916 | | | 3.3 | % | | BBB |
| Coterra Energy | | 1 | | | 309 | | | 2.9 | % | | 5,554 | | | 3.1 | % | | BBB |
| T-Mobile | | 5 | | | 294 | | | 2.8 | % | | 5,400 | | | 3.0 | % | | BB+ |
| Teva Pharmaceuticals | | 1 | | | 188 | | | 1.8 | % | | 5,254 | | | 2.9 | % | | BB- |
| Total | | 41 | | | 4,364 | | | 41.0 | % | | $ | 86,513 | | | 48.1 | % | | |
(1) One of the Cigna/Express Scripts leases and one of the CVS/Aetna leases expired as scheduled on January 1, 2022.
| | | | | | | | | | | | | | | | | | | | | | | | | | | | | | | | | |
| Tenant Industry Concentration | | Number of Leases | | Leased Square Feet | | Square Feet as a % of Total Portfolio | | Annualized Base Rent | | Annualized Base Rent as a % of Total Portfolio | |
| Health Care Equipment & Services | | 15 | | | 1,557 | | | 14.6 | % | | $ | 28,674 | | | 15.9 | % | |
| Government & Public Services | | 20 | | | 889 | | | 8.4 | % | | 21,393 | | | 11.9 | % | |
| Insurance | | 6 | | | 795 | | | 7.5 | % | | 16,478 | | | 9.2 | % | |
| Financial Institutions | | 4 | | | 696 | | | 6.5 | % | | 16,033 | | | 8.9 | % | |
| Software & Services | | 7 | | | 863 | | | 8.1 | % | | 14,597 | | | 8.1 | % | |
| Capital Goods | | 10 | | | 798 | | | 7.5 | % | | 12,247 | | | 6.8 | % | |
| Pharmaceuticals, Biotechnology & Life Sciences | | 2 | | | 364 | | | 3.4 | % | | 10,249 | | | 5.7 | % | |
| Consumer Durables & Apparel | | 3 | | | 375 | | | 3.5 | % | | 8,362 | | | 4.6 | % | |
| Telecommunication Services | | 6 | | | 497 | | | 4.7 | % | | 8,118 | | | 4.5 | % | |
| Energy | | 3 | | | 468 | | | 4.4 | % | | 7,305 | | | 4.2 | % | |
| Total | | 76 | | | 7,302 | | | 68.6 | % | | $ | 143,456 | | | 79.8 | % | |
| | | | | | | | | | | | | | | | | | | | | | | | | | | | | | | | | |
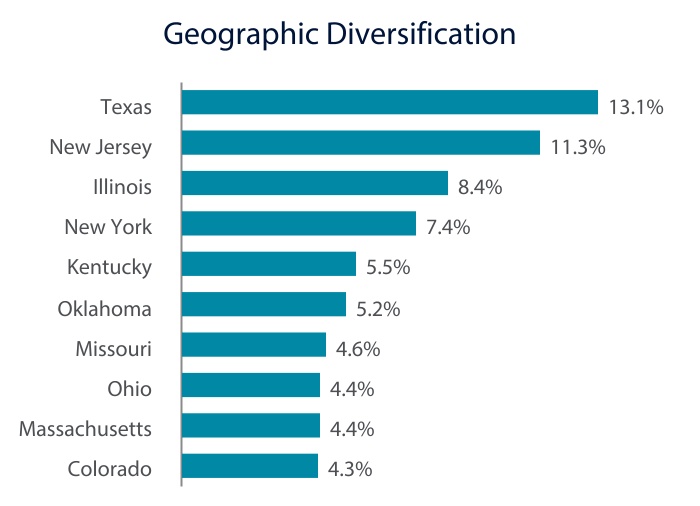
| Geographic Concentration | | Number of Properties | | Rentable Square Feet | | Square Feet as a % of Total Portfolio | | Annualized Base Rent | | Annualized Base Rent as a % of Total Portfolio | |
| Texas | | 15 | | | 1,353 | | | 12.7 | % | | $ | 23,621 | | | 13.1 | % | |
| New Jersey | | 4 | | | 829 | | | 7.8 | % | | 20,262 | | | 11.3 | % | |
| Illinois | | 12 | | | 1,322 | | | 12.4 | % | | 15,193 | | | 8.4 | % | |
| New York | | 5 | | | 787 | | | 7.4 | % | | 13,383 | | | 7.4 | % | |
| Kentucky | | 2 | | | 458 | | | 4.3 | % | | 9,946 | | | 5.5 | % | |
| Oklahoma | | 3 | | | 585 | | | 5.5 | % | | 9,411 | | | 5.2 | % | |
| Missouri | | 4 | | | 529 | | | 5.0 | % | | 8,317 | | | 4.6 | % | |
| Ohio | | 5 | | | 650 | | | 6.1 | % | | 7,964 | | | 4.4 | % | |
| Massachusetts | | 2 | | | 378 | | | 3.6 | % | | 7,920 | | | 4.4 | % | |
| Colorado | | 4 | | | 570 | | | 5.4 | % | | 7,735 | | | 4.3 | % | |
| Total | | 56 | | | 7,461 | | | 70.2 | % | | $ | 123,752 | | | 68.6 | % | |
See the Definitions section for a description of the Company's non-GAAP and operating metrics.
Orion Office REIT Inc. | WWW.ONLREIT.COM | 19
| | | | | | | | |
| | |
| Q4 2021 SUPPLEMENTAL INFORMATION |
| | |
|
Tenants Comprising Over 1% of Annualized Base Rent (unaudited, square feet and dollars in thousands as of December 31, 2021) |
|
| | | | | | | | | | | | | | | | | | | | | | | | | | | | | | | | | | | | | | |
| Tenant | | Number of Leases | | Leased Square Feet | | Square Feet as a % of Total Portfolio | | Annualized Base Rent | | Annualized Base Rent as a % of Total Portfolio | | Credit Rating |
| General Service Administration | | 18 | | | 845 | | | 7.9 | % | | $ | 20,845 | | | 11.6 | % | | AA+ |
| Merrill Lynch | | 1 | | | 482 | | | 4.5 | % | | 11,805 | | | 6.6 | % | | A- |
Cigna/Express Scripts (1) | | 4 | | | 592 | | | 5.6 | % | | 10,109 | | | 5.6 | % | | A- |
| Highmark Western & Northeastern NY | | 1 | | | 430 | | | 4.0 | % | | 8,208 | | | 4.6 | % | | NR |
| RSA Security | | 2 | | | 328 | | | 3.1 | % | | 7,221 | | | 4.0 | % | | BBB |
| Walgreens | | 6 | | | 574 | | | 5.4 | % | | 6,201 | | | 3.4 | % | | BBB |
CVS/Aetna (1) | | 2 | | | 322 | | | 3.0 | % | | 5,916 | | | 3.3 | % | | BBB |
| Coterra Energy | | 1 | | | 309 | | | 2.9 | % | | 5,554 | | | 3.1 | % | | BBB |
| T-Mobile | | 5 | | | 294 | | | 2.8 | % | | 5,400 | | | 3.0 | % | | BB+ |
| Teva Pharmaceuticals | | 1 | | | 188 | | | 1.8 | % | | 5,254 | | | 2.9 | % | | BB- |
| Novartis | | 1 | | | 176 | | | 1.7 | % | | 4,995 | | | 2.8 | % | | AA- |
| FedEx | | 2 | | | 352 | | | 3.3 | % | | 4,469 | | | 2.5 | % | | BBB |
| MDC Holdings Inc. | | 1 | | | 144 | | | 1.4 | % | | 4,215 | | | 2.3 | % | | BBB- |
| Charter Communications | | 2 | | | 264 | | | 2.5 | % | | 3,634 | | | 2.0 | % | | BB+ |
| Inform Diagnostics | | 1 | | | 172 | | | 1.6 | % | | 3,413 | | | 1.9 | % | | NR |
| Banner Life Insurance | | 1 | | | 116 | | | 1.1 | % | | 3,408 | | | 1.9 | % | | AA |
| Encompass Health | | 1 | | | 65 | | | 0.6 | % | | 3,369 | | | 1.9 | % | | BB- |
| Collins Aerospace | | 1 | | | 207 | | | 1.9 | % | | 3,232 | | | 1.8 | % | | A- |
| Home Depot/HD Supply | | 3 | | | 153 | | | 1.4 | % | | 3,059 | | | 1.7 | % | | A |
| Experian | | 1 | | | 178 | | | 1.7 | % | | 2,915 | | | 1.6 | % | | A- |
| AAA | | 1 | | | 147 | | | 1.4 | % | | 2,847 | | | 1.6 | % | | NR |
| Tronox | | 1 | | | 120 | | | 1.1 | % | | 2,728 | | | 1.5 | % | | B |
| AT&T | | 1 | | | 203 | | | 1.9 | % | | 2,718 | | | 1.5 | % | | BBB |
| Citigroup | | 1 | | | 64 | | | 0.6 | % | | 2,273 | | | 1.3 | % | | BBB+ |
| Hasbro | | 1 | | | 136 | | | 1.3 | % | | 2,242 | | | 1.2 | % | | BBB |
| NTT Data | | 1 | | | 150 | | | 1.4 | % | | 2,237 | | | 1.2 | % | | NR |
| Ingram Micro | | 1 | | | 200 | | | 1.9 | % | | 2,197 | | | 1.2 | % | | BB- |
| Linde | | 1 | | | 120 | | | 1.1 | % | | 2,138 | | | 1.2 | % | | A |
| Novus International | | 1 | | | 96 | | | 0.9 | % | | 2,022 | | | 1.1 | % | | NR |
| NetJets | | 1 | | | 140 | | | 1.3 | % | | 1,941 | | | 1.1 | % | | NR |
| Maximus | | 2 | | | 196 | | | 1.8 | % | | 1,923 | | | 1.1 | % | | BB+ |
| Pulte Mortgage | | 1 | | | 95 | | | 0.9 | % | | 1,905 | | | 1.1 | % | | BBB- |
| Fiserv | | 1 | | | 150 | | | 1.4 | % | | 1,800 | | | 1.0 | % | | BBB |
| Elementis | | 1 | | | 66 | | | 0.6 | % | | 1,754 | | | 1.0 | % | | NR |
| Total | | 70 | | | 8,074 | | | 75.8 | % | | 153,947 | | | 85.6 | % | | |
(1) One of the Cigna/Express Scripts leases and one of the CVS/Aetna leases expired as scheduled on January 1, 2022.
See the Definitions section for a description of the Company's non-GAAP and operating metrics.
Orion Office REIT Inc. | WWW.ONLREIT.COM | 20
| | | | | | | | |
| | |
| Q4 2021 SUPPLEMENTAL INFORMATION |
| | |
|
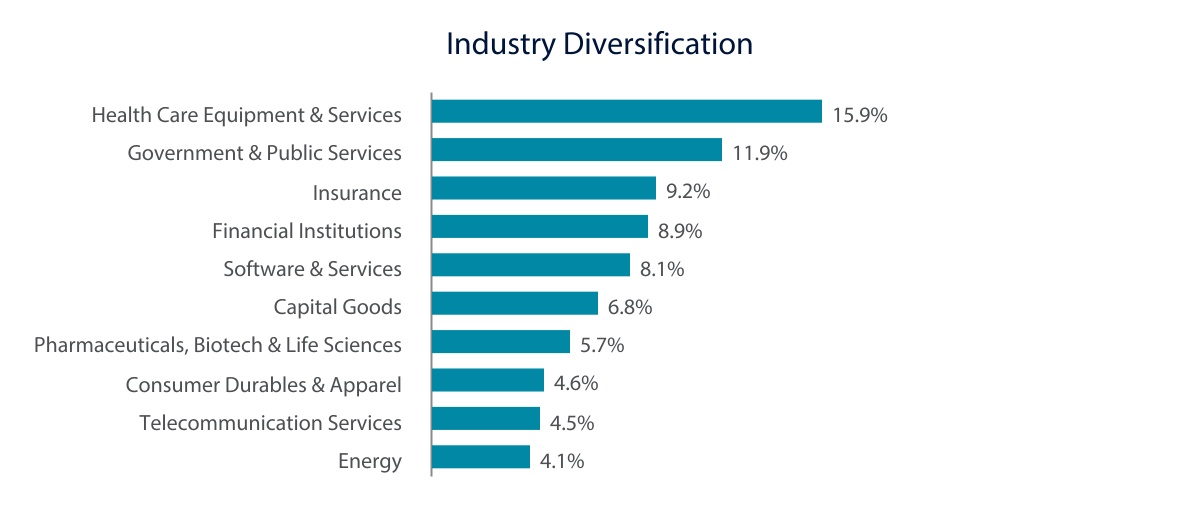
Diversification: Tenant Industry (unaudited, square feet and dollars in thousands as of December 31, 2021) |
|
| | | | | | | | | | | | | | | | | | | | | | | | | | | | | | | | |
| Industry | | Number of Leases | | Leased Square Feet | | Leased Square Feet as a % of Total Portfolio | | Annualized Base Rent | | Annualized Base Rent as a % of Total Portfolio |
| Health Care Equipment & Services | | 15 | | | 1,557 | | | 14.6 | % | | $ | 28,674 | | | 15.9 | % |
| Government & Public Services | | 20 | | | 889 | | | 8.4 | % | | 21,393 | | | 11.9 | % |
| Insurance | | 6 | | | 795 | | | 7.5 | % | | 16,478 | | | 9.2 | % |
| Financial Institutions | | 4 | | | 696 | | | 6.5 | % | | 16,033 | | | 8.9 | % |
| Software & Services | | 7 | | | 863 | | | 8.1 | % | | 14,597 | | | 8.1 | % |
| Capital Goods | | 10 | | | 798 | | | 7.5 | % | | 12,247 | | | 6.8 | % |
| Pharmaceuticals, Biotechnology & Life Sciences | | 2 | | | 364 | | | 3.4 | % | | 10,249 | | | 5.7 | % |
| Consumer Durables & Apparel | | 3 | | | 375 | | | 3.5 | % | | 8,362 | | | 4.6 | % |
| Telecommunication Services | | 6 | | | 497 | | | 4.7 | % | | 8,118 | | | 4.5 | % |
| Energy | | 3 | | | 468 | | | 4.4 | % | | 7,305 | | | 4.2 | % |
| Transportation | | 5 | | | 541 | | | 5.1 | % | | 7,143 | | | 4.0 | % |
| Commercial & Professional Services | | 9 | | | 502 | | | 4.7 | % | | 6,967 | | | 3.9 | % |
| Materials | | 4 | | | 311 | | | 2.9 | % | | 6,709 | | | 3.7 | % |
| Food & Staples Retailing | | 6 | | | 574 | | | 5.4 | % | | 6,201 | | | 3.4 | % |
| Media & Entertainment | | 2 | | | 264 | | | 2.5 | % | | 3,634 | | | 2.0 | % |
| Retailing | | 4 | | | 157 | | | 1.5 | % | | 3,131 | | | 1.7 | % |
| Food, Beverage & Tobacco | | 1 | | | 96 | | | 0.9 | % | | 2,022 | | | 1.1 | % |
| Utilities | | 1 | | | 25 | | | 0.2 | % | | 394 | | | 0.2 | % |
| Consumer Services | | 3 | | | 7 | | | 0.1 | % | | 91 | | | 0.2 | % |
| Real Estate | | 1 | | | 4 | | | — | % | | 85 | | | — | % |
| Total | | 112 | | | 9,783 | | | 91.9 | % | | $ | 179,833 | | | 100.0 | % |
See the Definitions section for a description of the Company's non-GAAP and operating metrics.
Orion Office REIT Inc. | WWW.ONLREIT.COM | 21
| | | | | | | | |
| | |
| Q4 2021 SUPPLEMENTAL INFORMATION |
| | |
|
Diversification: Property Geographic (unaudited, square feet and dollars in thousands as of December 31, 2021) |
|
| | | | | | | | | | | | | | | | | | | | | | | | | | | | | | | | |
| Location | | Number of Properties | | Rentable Square Feet | | Square Feet as a % of Total Portfolio | | Annualized Base Rent | | Annualized Base Rent as a % of Total Portfolio |
| United States | | | | | | | | | | |
| Arizona | | 3 | | | 239 | | | 2.2 | % | | $ | 2,151 | | | 1.2 | % |
| California | | 4 | | | 262 | | | 2.5 | % | | 5,275 | | | 2.9 | % |
| Colorado | | 4 | | | 570 | | | 5.4 | % | | 7,735 | | | 4.3 | % |
| Florida | | 2 | | | 53 | | | 0.5 | % | | 221 | | | 0.1 | % |
| Georgia | | 3 | | | 284 | | | 2.7 | % | | 4,493 | | | 2.5 | % |
| Idaho | | 2 | | | 45 | | | 0.4 | % | | 1,019 | | | 0.6 | % |
| Illinois | | 12 | | | 1,322 | | | 12.4 | % | | 15,193 | | | 8.4 | % |
| Indiana | | 1 | | | 83 | | | 0.8 | % | | 538 | | | 0.3 | % |
| Iowa | | 3 | | | 137 | | | 1.3 | % | | 2,632 | | | 1.5 | % |
| Kansas | | 2 | | | 196 | | | 1.8 | % | | 1,923 | | | 1.1 | % |
| Kentucky | | 2 | | | 458 | | | 4.3 | % | | 9,946 | | | 5.5 | % |
| Maryland | | 2 | | | 236 | | | 2.2 | % | | 6,136 | | | 3.4 | % |
| Massachusetts | | 2 | | | 378 | | | 3.6 | % | | 7,920 | | | 4.4 | % |
| Minnesota | | 1 | | | 39 | | | 0.4 | % | | 493 | | | 0.3 | % |
| Missouri | | 4 | | | 529 | | | 5.0 | % | | 8,317 | | | 4.6 | % |
| Nebraska | | 2 | | | 180 | | | 1.7 | % | | 2,729 | | | 1.5 | % |
| New Jersey | | 4 | | | 829 | | | 7.8 | % | | 20,262 | | | 11.3 | % |
| New York | | 5 | | | 787 | | | 7.4 | % | | 13,383 | | | 7.4 | % |
| Ohio | | 5 | | | 650 | | | 6.1 | % | | 7,956 | | | 4.4 | % |
| Oklahoma | | 3 | | | 585 | | | 5.5 | % | | 9,411 | | | 5.2 | % |
| Oregon | | 1 | | | 69 | | | 0.6 | % | | 1,120 | | | 0.6 | % |
| Pennsylvania | | 4 | | | 336 | | | 3.2 | % | | 7,694 | | | 4.3 | % |
| Rhode Island | | 2 | | | 206 | | | 1.9 | % | | 3,016 | | | 1.7 | % |
| South Carolina | | 1 | | | 64 | | | 0.6 | % | | 2,273 | | | 1.3 | % |
| Tennessee | | 4 | | | 240 | | | 2.3 | % | | 4,490 | | | 2.5 | % |
| Texas | | 15 | | | 1,353 | | | 12.7 | % | | 23,621 | | | 13.1 | % |
| Virginia | | 2 | | | 240 | | | 2.3 | % | | 4,331 | | | 2.4 | % |
| West Virginia | | 1 | | | 64 | | | 0.6 | % | | 1,086 | | | 0.6 | % |
| Wisconsin | | 1 | | | 155 | | | 1.3 | % | | 2,188 | | | 1.3 | % |
| Territories | | | | | | | | | | |
| Puerto Rico | | 1 | | | 57 | | | 0.5 | % | | 2,282 | | | 1.3 | % |
| Total | | 98 | | | 10,646 | | | 100.0 | % | | $ | 179,834 | | | 100.0 | % |
See the Definitions section for a description of the Company's non-GAAP and operating metrics.
Orion Office REIT Inc. | WWW.ONLREIT.COM | 22
| | | | | | | | |
| | |
| Q4 2021 SUPPLEMENTAL INFORMATION |
| | |
|
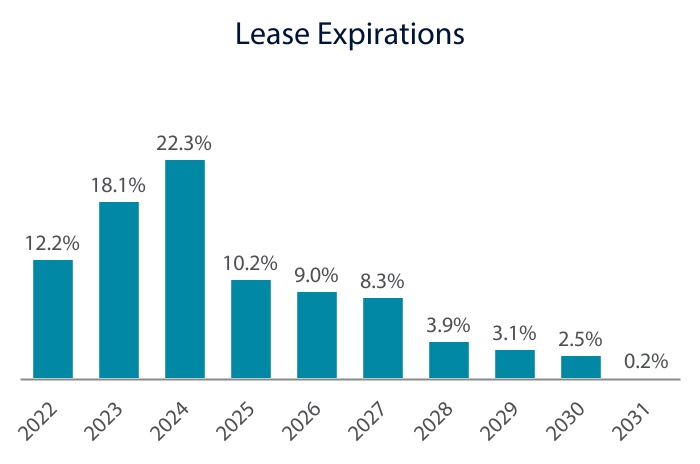
Lease Expirations (unaudited, square feet and dollars in thousands as of December 31, 2021) |
|
| | | | | | | | | | | | | | | | | | | | | | | | | | | | | | | | |
Year of Expiration (1) | | Number of Leases
Expiring (2) | | Leased
Square Feet | | Leased Square Feet as a % of Total Portfolio | | Annualized Base Rent | | Annualized Base Rent as a % of Total Portfolio |
| 2022 | | 14 | | | 1,168 | | | 11.0 | % | | $ | 21,923 | | | 12.2 | % |
| 2023 | | 22 | | | 2,156 | | | 20.3 | % | | 32,564 | | | 18.1 | % |
| 2024 | | 18 | | | 2,029 | | | 19.1 | % | | 40,024 | | | 22.3 | % |
| 2025 | | 11 | | | 1,046 | | | 9.8 | % | | 18,344 | | | 10.2 | % |
| 2026 | | 12 | | | 741 | | | 7.0 | % | | 16,222 | | | 9.0 | % |
| 2027 | | 11 | | | 884 | | | 8.3 | % | | 14,883 | | | 8.3 | % |
| 2028 | | 8 | | | 348 | | | 3.3 | % | | 6,961 | | | 3.9 | % |
| 2029 | | 3 | | | 392 | | | 3.7 | % | | 5,659 | | | 3.1 | % |
| 2030 | | 2 | | | 98 | | | 0.9 | % | | 4,468 | | | 2.5 | % |
| 2031 | | 1 | | | 11 | | | 0.1 | % | | 399 | | | 0.2 | % |
| Thereafter | | 8 | | | 847 | | | 7.8 | % | | 17,825 | | | 9.9 | % |
| Total | | 110 | | | 9,720 | | | 91.3 | % | | $ | 179,272 | | | 99.7 | % |
__________________________________
(1) Includes the Company's pro rata share of properties owned by the Unconsolidated Joint Venture.
(2) The Company has certain properties that are subject to multiple leases.
See the Definitions section for a description of the Company's non-GAAP and operating metrics.
Orion Office REIT Inc. | WWW.ONLREIT.COM | 23
| | | | | | | | |
| | |
| Q4 2021 SUPPLEMENTAL INFORMATION |
Rent Escalations
(square feet and dollars in thousands as of December 31, 2021)
| | | | | | | | | | | | | | | | | | | | | | | | | | | | | | | | |
| | Number of Leases | | Leased
Square Feet | | Leased Square Feet as a % of Total Portfolio | | Annualized Base Rent | | Annualized Base Rent as a % of Total Portfolio |
| Fixed dollar or percent increase | | 91 | | | 8,534 | | | 80.2 | % | | $ | 154,898 | | | 86.1 | % |
| Flat | | 17 | | | 977 | | | 9.2 | % | | 20,106 | | | 11.2 | % |
| CPI | | 4 | | | 272 | | | 2.5 | % | | 4,829 | | | 2.7 | % |
| Total | | 112 | | | 9,783 | | | 91.9 | % | | $ | 179,833 | | | 100.0 | % |
Tenant Expense Obligation
(square feet and dollars in thousands as of December 31, 2021)
| | | | | | | | | | | | | | | | | | | | | | | | | | | | | | | | |
| | Number of Leases | | Leased
Square Feet | | Leased Square Feet as a % of Total Portfolio | | Annualized Base Rent | | Annualized Base Rent as a % of Total Portfolio |
| NN | | 65 | | | 6,388 | | | 60.0 | % | | $ | 117,501 | | | 65.3 | % |
| Modified Gross | | 22 | | | 1,205 | | | 11.3 | % | | 32,201 | | | 17.9 | % |
| NNN | | 23 | | | 2,185 | | | 20.6 | % | | 30,076 | | | 16.8 | % |
| Gross | | 2 | | | 5 | | | — | % | | 55 | | | — | % |
| Total | | 112 | | | 9,783 | | | 91.9 | % | | $ | 179,833 | | | 100.0 | % |
See the Definitions section for a description of the Company's non-GAAP and operating metrics.
Orion Office REIT Inc. | WWW.ONLREIT.COM | 24
| | | | | | | | |
| | |
| Q4 2021 SUPPLEMENTAL INFORMATION |
| | |
|
Unconsolidated Joint Venture Investment Summary (unaudited, square feet and dollars in thousands) |
|
The following table summarizes the Company's investments in the Arch Street Unconsolidated Joint Venture as of December 31, 2021.
| | | | | | | | | | | | | | | | | | | | | | | | | | | | | | | | | | | | | | | | |
| | Legal Ownership Percentage (1) | | | Property Type | | Pro Rata Share of Gross Real Estate Investments | | Pro Rata Share of Rentable Square Feet | | Pro Rata Share of Annualized Base Rent | | Pro Rata Share of Principal Outstanding | |
| Schneider Electric - Foxboro, MA | | 20% | | | Office | | $ | 8,336 | | | 50 | | | $ | 699 | | | $ | 5,090 | | |
| Sysmex - Lincolnshire, IL | | 20% | | | Office | | 9,239 | | | 33 | | | 779 | | | 5,448 | | |
| DHL - Westerville, OH | | 20% | | | Office | | 6,676 | | | 29 | | | 422 | | | 3,972 | | |
| Peraton - Herndon, VA | | 20% | | | Office | | 9,662 | | | 33 | | | 1,099 | | | 6,000 | | |
| Atlas Air - Erlanger, KY | | 20% | | | Office | | 5,330 | | | 20 | | | 311 | | | 3,162 | | |
| Spire Energy - St. Louis, MO | | 20% | | | Office | | 6,159 | | | 26 | | | 394 | | | 3,660 | | |
| | | | | | | $ | 45,402 | | | 191 | | | $ | 3,704 | | | $ | 27,332 | | |
__________________________________
(1)Legal ownership percentage may, at times, not equal the Company's economic interest because of various provisions in the joint venture agreement regarding capital contributions, distributions of cash flow based on capital account balances and allocations of profits and losses.
See the Definitions section for a description of the Company's non-GAAP and operating metrics.
Orion Office REIT Inc. | WWW.ONLREIT.COM | 25
| | | | | | | | |
| | |
| Q4 2021 SUPPLEMENTAL INFORMATION |
| | |
|
Definitions (unaudited, in thousands, except share and per share data) |
|
Annualized Base Rent is the monthly aggregate cash amount charged to tenants under our leases (including monthly base rent receivables and certain contractually obligated reimbursements by our tenants), as of the final date of the applicable period, multiplied by 12, including the Company's pro rata share of such amounts related to the Unconsolidated Joint Venture.
Cash Cap Rate for real estate properties equals the estimated future 12-month Cash NOI, excluding any rent concessions or abatements, at the time of the acquisition or disposition divided by the purchase or sale price. For any properties acquired or disposed of as a portfolio, the amount presented represents the portfolio cash cap rate. For certain properties, the Cash Cap Rate may be equal to future 12-month contractual rental revenue, excluding any rent concessions or abatements, divided by the purchase price or sale price, as the majority of the Company's properties are subject to Net Leases.
CPI refers to a lease in which base rent is adjusted based on changes in a consumer price index.
Double Net Lease ("NN") is a lease under which the tenant agrees to pay all operating expenses associated with the property (e.g., real estate taxes, insurance, maintenance), but excludes some or all major repairs (e.g., roof, structure, parking lot, in each case, as further defined in the applicable lease).
Earnings Before Interest, Taxes, Depreciation and Amortization for Real Estate ("EBITDAre") and Adjusted EBITDA
Due to certain unique operating characteristics of real estate companies, as discussed below, the National Association of Real Estate Investment Trusts, Inc. ("Nareit"), an industry trade group, has promulgated a supplemental performance measure known as Earnings Before Interest, Taxes, Depreciation and Amortization for Real Estate. Nareit defines EBITDAre as net income or loss computed in accordance with GAAP, adjusted for interest expense, income tax expense (benefit), depreciation and amortization, impairment write-downs on real estate, gains or losses from disposition of property and our pro rata share of EBITDAre adjustments related to the Unconsolidated Joint Venture. We calculated EBITDAre in accordance with Nareit's definition described above.
In addition to EBITDAre, we use Adjusted EBITDA as a non-GAAP supplemental performance measure to evaluate the operating performance of the Company. Adjusted EBITDA, as defined by the Company, represents EBITDAre, modified to exclude non-routine items such as acquisition-related expenses and transaction costs. We also exclude certain non-cash items such as impairments of intangible and right of use assets, gains or losses on derivatives, gains or losses on the extinguishment or forgiveness of debt, amortization of intangibles, above-market lease assets and deferred lease incentives, net of amortization of below-market lease liabilities and our pro rata share of Adjusted EBITDA adjustments related to the Unconsolidated Joint Venture. Management believes that excluding these costs from EBITDAre provides investors with supplemental performance information that is consistent with the performance models and analysis used by management, and provides investors a view of the performance of our portfolio over time. Therefore, EBITDAre and Adjusted EBITDA should not be considered as an alternative to net income, as computed in accordance with GAAP. The Company uses Adjusted EBITDA as one measure of its operating performance when formulating corporate goals and evaluating the effectiveness of the Company's strategies. EBITDAre and Adjusted EBITDA may not be comparable to similarly titled measures of other companies.
Occupancy Rate equals the sum of Leased Square Feet divided by Rentable Square Feet and includes the Company's pro rata share of such amounts related to the Unconsolidated Joint Venture, in each case, as of an applicable date.
Enterprise Value equals the sum of the Implied Equity Market Capitalization and Net Debt, in each case, as of an applicable date.
Fixed Charge Coverage Ratio is (a) the sum of (i) Interest Expense, excluding non-cash amortization and (ii) secured debt principal amortization on Adjusted Principal Outstanding, divided by (b) Adjusted EBITDA. Management believes that Fixed Charge Coverage Ratio is a useful supplemental measure of our ability to satisfy fixed financing obligations.
Fixed Dollar or Percent Increase refers to a lease that requires contractual rent increases during the initial term of the lease agreement. A Fixed Dollar or Percent Increase lease may include a period of free rent at the beginning or end of the lease.
Orion Office REIT Inc. | WWW.ONLREIT.COM | 26
| | | | | | | | |
| | |
| Q4 2021 SUPPLEMENTAL INFORMATION |
| | |
|
Definitions (cont.) (unaudited, in thousands, except share and per share data) |
|
Flat refers to a lease that requires equal rent payments, with no contractual increases, throughout the initial term of the lease agreement. A Flat Lease may include a period of free rent at the beginning or end of the lease.
Funds Available for Distribution ("FAD")
Funds available for distribution, as defined by the Company, represents Core FFO, as defined below, modified to exclude capital expenditures, as well as certain non-cash items such as amortization of deferred financing costs, amortization of above market leases and deferred lease incentives, net of amortization of below market lease liabilities, straight-line rental revenue, equity-based compensation, equity in income or losses of the Unconsolidated Joint Venture and our pro rata share of FAD adjustments related to the Unconsolidated Joint Venture. Management believes that adjusting these items from Core FFO provides investors with supplemental performance information that is consistent with the performance models and analysis used by management and provides useful information regarding the Company's ability to fund its dividend.
However, not all REITs calculate FAD and those that do may not calculate FAD the same way, so comparisons with other REITs may not be meaningful. FAD should not be considered as an alternative to net income (loss) or cash flow provided by operating activities as determined under GAAP.
Nareit Funds from Operations ("Nareit FFO" or "FFO") and Core Funds from Operations ("Core FFO")
Due to certain unique operating characteristics of real estate companies, as discussed below, Nareit has promulgated a supplemental performance measure known as FFO, which we believe to be an appropriate supplemental performance measure to reflect the operating performance of a REIT. FFO is not equivalent to our net income or loss as determined under GAAP.
Nareit defines FFO as net income or loss computed in accordance with GAAP adjusted for gains or losses from disposition of real estate assets, depreciation and amortization of real estate assets, impairment write-downs on real estate, and our pro rata share of FFO adjustments related to the Unconsolidated Joint Venture. We calculate FFO in accordance with Nareit's definition described above.
In addition to FFO, we use Core FFO as a non-GAAP supplemental financial performance measure to evaluate the operating performance of the Company. Core FFO, as defined by the Company, excludes from FFO non-recurring or infrequent items such as acquisition-related expenses, transaction costs and gains or losses on extinguishment of swaps and/or debt. Core FFO allows for a comparison of the performance of our operations with other publicly-traded REITs, as Core FFO, or an equivalent measure, is routinely reported by publicly-traded REITs, and we believe often used by analysts and investors for comparison purposes.
For all of these reasons, we believe FFO and Core FFO, in addition to net income (loss), as defined by GAAP, are helpful supplemental performance measures and useful in understanding the various ways in which our management evaluates the performance of the Company over time. However, not all REITs calculate FFO and Core FFO the same way, so comparisons with other REITs may not be meaningful. FFO and Core FFO should not be considered as alternatives to net income (loss) and are not intended to be used as a liquidity measure indicative of cash flow available to fund our cash needs. Neither the SEC, Nareit, nor any other regulatory body has evaluated the acceptability of the exclusions used to adjust FFO in order to calculate Core FFO and its use as a non-GAAP financial performance measure.
GAAP is an abbreviation for generally accepted accounting principles in the United States.
Gross Lease is a lease under which the landlord is responsible for all expenses associated with the property (e.g., real estate taxes, insurance, maintenance and repairs).
Gross Real Estate Investments represent total gross real estate and related assets of Operating Properties and the Company's pro rata share of such amounts related to properties owned by the Unconsolidated Joint Venture, net of gross intangible lease liabilities. Gross Real Estate Investments should not be considered as an alternative to the Company's real estate investments balance as determined in accordance with GAAP or any other GAAP financial measures and should only be considered together with, and as a supplement to, the Company's financial information prepared in accordance with GAAP.
Orion Office REIT Inc. | WWW.ONLREIT.COM | 27
| | | | | | | | |
| | |
| Q4 2021 SUPPLEMENTAL INFORMATION |
| | |
|
Definitions (cont.) (unaudited, in thousands, except share and per share data) |
|
The following table shows a reconciliation of Gross Real Estate Investments to the amounts presented in accordance with GAAP on the balance sheet for the periods presented (dollar amounts in thousands):
| | | | | | | | |
| | December 31,
2021 |
| Total real estate investments, at cost - as reported | | $ | 1,481,745 | |
| Adjustments: | | |
| | |
| | |
| | |
| Intangible lease assets, net | | 370,049 | |
| | |
| | |
| Gross intangible lease liabilities | | (35,068) | |
Proportionate share of Unconsolidated Joint Venture Gross Real Estate Investments | | 45,401 | |
| | |
| Gross Real Estate Investments | | $ | 1,862,127 | |
Implied Equity Market Capitalization equals shares of common stock outstanding as of an applicable date, multiplied by the closing sale price of the Company's stock as reported on the New York Stock Exchange on such date.
Industry is derived from the Global Industry Classification Standard ("GICS") Methodology that was developed by Morgan Stanley Capital International ("MSCI") in collaboration with S&P Dow Jones Indices to establish a global, accurate, complete and widely accepted approach to defining industries and classifying securities by industry.
Interest Coverage Ratio equals Adjusted EBITDA divided by Interest Expense, excluding non-cash amortization. Management believes that Interest Coverage Ratio is a useful supplemental measure of our ability to service our debt obligations.
Interest Expense, excluding non-cash amortization is a non-GAAP measure that represents interest expense incurred on the outstanding principal balance of our debt and the Company's pro rata share of the Unconsolidated Joint Venture's interest expense incurred on its outstanding principal balance. This measure excludes the amortization of deferred financing costs, premiums and discounts, which is included in interest expense in accordance with GAAP. Interest Expense, excluding non-cash amortization should not be considered as an alternative to the Company's interest expense as determined in accordance with GAAP or any other GAAP financial measures and should only be considered together with and as a supplement to the Company's financial information prepared in accordance with GAAP.
The following table shows a reconciliation of Interest Expense, excluding non-cash amortization to interest expense presented in accordance with GAAP on the statements of operations for the periods presented (dollar amounts in thousands):
| | | | | | | | |
| | Three Months Ended |
| | December 31,
2021 |
| Interest expense - as reported | | $ | 3,187 | |
| Adjustments: | | |
| Amortization of deferred financing costs and other non-cash charges | | (729) | |
| | |
Proportionate share of Unconsolidated Joint Venture Interest Expense, excluding non-cash amortization | | 64 | |
| | |
| Interest Expense, excluding non-cash amortization | | $ | 2,522 | |
Investment-Grade Tenants are those with a Standard & Poor’s credit rating of BBB- or higher or a Moody’s credit rating of Baa3 or higher. The ratings may reflect those assigned by Standard & Poor’s or Moody’s to the lease guarantor or the parent company, as applicable.
Leased Square Feet is Rentable Square Feet leased and includes such amounts related to the Unconsolidated Joint Venture.
Modified Gross Lease is a lease under which the landlord is responsible for most expenses associated with the property (e.g., real estate taxes, insurance, maintenance and repairs), but passes through some operating expenses to the tenant.
Net Debt, Principal Outstanding and Adjusted Principal Outstanding
Orion Office REIT Inc. | WWW.ONLREIT.COM | 28
| | | | | | | | |
| | |
| Q4 2021 SUPPLEMENTAL INFORMATION |
| | |
|
Definitions (cont.) (unaudited, in thousands, except share and per share data) |
|
Principal Outstanding is a non-GAAP measure that represents the Company's outstanding principal debt balance, excluding certain GAAP adjustments, such as premiums and discounts, financing and issuance costs, and related accumulated amortization. Adjusted Principal Outstanding includes the Company's pro rata share of the Unconsolidated Joint Venture's outstanding principal debt balance. We believe that the presentation of Principal Outstanding and Adjusted Principal Outstanding, which show our contractual debt obligations, provides useful information to investors to assess our overall financial flexibility, capital structure and leverage. Principal Outstanding and Adjusted Principal Outstanding should not be considered as alternatives to the Company's consolidated debt balance as determined in accordance with GAAP or any other GAAP financial measures and should only be considered together with, and as a supplement to, the Company's financial information prepared in accordance with GAAP.
Net Debt is a non-GAAP measure used to show the Company's Adjusted Principal Outstanding, less all cash and cash equivalents and the Company's pro rata share of the Unconsolidated Joint Venture's cash and cash equivalents. We believe that the presentation of Net Debt provides useful information to investors because our management reviews Net Debt as part of its management of our overall liquidity, financial flexibility, capital structure and leverage.
The following table shows a reconciliation of Net Debt, Principal Outstanding and Adjusted Principal Outstanding to the amounts presented in accordance with GAAP on the balance sheet for the periods presented (dollar amounts in thousands):
| | | | | | | | |
| | December 31,
2021 |
| CMBS bridge facility, net | | $ | 354,357 | |
| Credit facility term loan, net | | 172,490 | |
| Credit facility revolver | | 90,000 | |
| | |
| | |
| Total debt - as reported | | 616,847 | |
| Deferred financing costs, net | | 3,153 | |
| | |
| Principal Outstanding | | 620,000 | |
Proportionate share of Unconsolidated Joint Venture Principal Outstanding | | 27,332 | |
| | |
| Adjusted Principal Outstanding | | $ | 647,332 | |
| Cash and cash equivalents | | (29,318) | |
Proportionate share of Unconsolidated Joint Venture cash and cash equivalents | | (590) | |
| | |
| Net Debt | | $ | 617,424 | |
Net Debt Leverage Ratio equals Net Debt divided by Gross Real Estate Investments.
Net Operating Income ("NOI") and Cash NOI
NOI is a non-GAAP performance measure used to evaluate the operating performance of a real estate company. NOI represents total revenues less property operating expenses and excludes fee revenue earned for services to the Unconsolidated Joint Venture, impairment, depreciation and amortization, general and administrative expenses, acquisition-related expenses and transaction costs. Cash NOI excludes the impact of certain GAAP adjustments included in rental revenue, such as straight-line rent adjustments and amortization of above-market intangible lease assets and below-market lease intangible liabilities. Cash NOI includes the pro rata share of such amounts from properties owned by the Unconsolidated Joint Venture. It is management's view that NOI and Cash NOI provide investors relevant and useful information because it reflects only income and operating expense items that are incurred at the property level and presents them on an unleveraged basis. NOI and Cash NOI should not be considered as an alternative to operating income in accordance with GAAP. Further, NOI and Cash NOI may not be comparable to similarly titled measures of other companies.
Orion Office REIT Inc. | WWW.ONLREIT.COM | 29
| | | | | | | | |
| | |
| Q4 2021 SUPPLEMENTAL INFORMATION |
| | |
|
Definitions (cont.) (unaudited, in thousands, except share and per share data) |
|
The following table shows the calculation of NOI and Cash NOI for the periods presented (dollar amounts in thousands):
| | | | | | | | |
| | Three Months Ended |
| | December 31,
2021 |
| Total revenues | | $ | 40,801 | |
| Less total operating expenses | | (92,006) | |
| Fee income from unconsolidated joint venture | | (271) | |
| Transaction costs | | 5,112 | |
| General and administrative | | 2,167 | |
| Depreciation and amortization | | 26,067 | |
| Impairment of real estate | | 49,859 | |
| NOI | | 31,729 | |
| Straight-line rent | | (575) | |
| Amortization of above-market lease assets and deferred lease incentives, net of amortization of below-market lease liabilities | | (295) | |
| Other non-cash adjustments | | 74 | |
Proportionate share of Unconsolidated Joint Venture Cash NOI | | 474 | |
| Cash NOI | | $ | 31,407 | |
Operating Properties refers to all properties owned and consolidated by the Company as of the applicable date.
Property Operating Expense includes reimbursable and non-reimbursable costs to operate a property, including real estate taxes, utilities, insurance, repairs, maintenance, legal, property management fees, etc.
Rentable Square Feet is leasable square feet of Operating Properties and the Company's pro rata share of leasable square feet of properties owned by the Unconsolidated Joint Venture.
Triple Net Lease ("NNN") is a lease under which the tenant agrees to pay all expenses associated with the property (e.g., real estate taxes, insurance, maintenance and repairs in accordance with the lease terms).
Unconsolidated Joint Venture includes the Company's investment in the Arch Street unconsolidated joint venture formed to acquire and own real estate properties.
Unencumbered Asset Ratio equals unencumbered Gross Real Estate Investments divided by Gross Real Estate Investments. Management believes that Unencumbered Asset Ratio is a useful supplemental measure of our overall liquidity and leverage.
Weighted Average Remaining Lease Term is the number of years remaining on each respective lease as of the applicable date, weighted based on Annualized Base Rent and includes the years remaining on each of the respective leases of the Unconsolidated Joint Venture, weighted based on the Company's pro rata share of Annualized Base Rent related to the Unconsolidated Joint Venture.
Orion Office REIT Inc. | WWW.ONLREIT.COM | 30