| | | | | | | | |
| | |
Q4 2022 SUPPLEMENTAL INFORMATION |
| | | | | |
| Orion Supplemental Information | |
December 31, 2022 | |
| | | | | |
| Section | Page |
| |
| Company Overview | |
| Balance Sheets | |
| Statements of Operations | |
| Funds From Operations (FFO), Core Funds From Operations (Core FFO) and Funds Available for Distribution (FAD) | |
| EBITDA, EBITDAre and Adjusted EBITDA | |
| Capital Structure | |
| Debt Detail | |
| Ratio Analysis | |
| Credit Facility Covenants | |
| Net Operating Income (NOI) and Cash NOI | |
| Leasing Activity | |
| Dispositions | |
| Diversification Statistics | |
| |
| Tenants Comprising Over 1% of Annualized Base Rent | |
| Tenant Industry Diversification | |
| Property Geographic Diversification | |
| Lease Expirations | |
| Lease Summary | |
| Full Portfolio | |
| Unconsolidated Joint Venture Investment Summary | |
| Definitions | |
Orion Office REIT Inc. | WWW.ONLREIT.COM | 2
| | | | | | | | |
| | |
Q4 2022 SUPPLEMENTAL INFORMATION |
This data and other information described herein are as of and for the quarter and year ended December 31, 2022, unless otherwise indicated. Future performance may not be consistent with past performance and is subject to change and inherent risks and uncertainties. This information should be read in conjunction with the consolidated and combined financial statements and the Management's Discussion and Analysis of Financial Condition and Results of Operations sections contained in Orion Office REIT Inc.'s (the "Company," "Orion," "us," "our" and "we") Annual Report on Form 10-K for the year ended December 31, 2022 and Quarterly Reports on Form 10-Q for the periods ended September 30, 2022, June 30, 2022, and March 31, 2022.
Orion Office REIT Inc. | WWW.ONLREIT.COM | 3
| | | | | | | | |
| | |
Q4 2022 SUPPLEMENTAL INFORMATION |
| | |
|
| Forward-Looking Statements |
|
Information set forth herein includes “forward-looking statements” which reflect the Company's expectations and projections regarding future events and plans, future financial condition, results of operations, liquidity and business, including leasing and occupancy, acquisitions, dispositions, rent receipts, the payment of future dividends, the Company’s growth and the impact of the coronavirus (COVID-19) on the Company's business. Generally, the words "anticipates," "assumes," "believes," "continues," "could," "estimates," "expects," "goals," "intends," "may," "plans," "projects," "seeks," "should," "targets," "will," "guidance", variations of such words and similar expressions identify forward-looking statements. These forward-looking statements are based on information currently available to the Company and involve a number of known and unknown assumptions and risks, uncertainties and other factors, which may be difficult to predict and beyond the Company's control, that could cause actual events and plans or could cause the Company's business, financial condition, liquidity and results of operations to differ materially from those expressed or implied in the forward-looking statements. Further, information regarding historical rent collections should not serve as an indication of future rent collections.
The following factors, among others, could cause actual results to differ materially from those set forth in the forward-looking statements:
•the risk of rising interest rates, including that our borrowing costs may increase and we may be unable to refinance our debt obligations on favorable terms and in a timely manner, or at all;
•the risk of inflation, including that our operating costs, such as insurance premiums, utilities, real estate taxes, capital expenditures and repair and maintenance costs, may rise;
•conditions associated with the global market, including an oversupply of office space, tenant credit risk and general economic conditions;
•the ongoing impact of the COVID-19 pandemic or any future pandemic or outbreak of a highly infectious or contagious disease or fear of such pandemics or outbreaks, on our business, operating results, financial condition and prospects, which is highly uncertain and cannot be predicted with confidence, including the impact on the U.S. economy and changes in tenant behavior that may continue to adversely affect the use of and demand for office space;
•our ability to acquire new properties and sell non-core assets on favorable terms and in a timely manner, or at all;
•our ability to comply with the terms of our credit agreements or to meet the debt obligations on certain of our properties;
•our ability to access the capital markets to raise additional equity or refinance maturing debt on favorable terms and in a timely manner, or at all;
•changes in the real estate industry and in performance of the financial markets and interest rates and our ability to effectively hedge against interest rate changes;
•the risk of tenants defaulting on their lease obligations, which is heightened due to our focus on single tenant properties;
•our ability to renew leases with existing tenants or re-let vacant space to new tenants on favorable terms and in a timely manner, or at all;
•the cost of rent concessions, tenant improvement allowances and leasing commissions;
•the potential for termination of existing leases pursuant to tenant termination rights;
•the amount, growth and relative inelasticity of our expenses;
•risks associated with the ownership and development of real property;
•risks accompanying the management of OAP/VER Venture, LLC (the “Arch Street Joint Venture”), our unconsolidated joint venture, in which we hold a non-controlling ownership interest;
•our ability to close pending real estate transactions, which may be subject to conditions that are outside of our control;
•risks associated with acquisitions, including the risk that we may not be in a position, or have the opportunity in the future, to make suitable property acquisitions on advantageous terms and/or that such acquisitions will fail to perform as expected;
•risks associated with the fact that we have a limited operating history and our future performance is difficult to predict;
•our properties may be subject to impairment charges;
Orion Office REIT Inc. | WWW.ONLREIT.COM | 4
| | | | | | | | |
| | |
Q4 2022 SUPPLEMENTAL INFORMATION |
•risks resulting from losses in excess or insured limits or uninsured losses;
•risks associated with the potential volatility of our common stock; and
•the risk that we may fail to maintain our qualification as a REIT
Additional factors that may affect future results are contained in the Company's filings with the SEC, which are available at the SEC’s website at www.sec.gov. The Company disclaims any obligation to publicly update or revise any forward-looking statements, whether as a result of changes in underlying assumptions or factors, new information, future events or otherwise, except as required by law.
Orion Office REIT Inc. | WWW.ONLREIT.COM | 5
| | | | | | | | |
| | |
Q4 2022 SUPPLEMENTAL INFORMATION |
| | |
|
Company Overview (unaudited) |
|
Orion is a real estate company incorporated in the state of Maryland on July 1, 2021, which has been operating in a manner so as to qualify and has elected to be taxed as a real estate investment trust ("REIT") for U.S. federal income tax purposes, commencing with our initial taxable year ended December 31, 2021.
Orion is a full-service real estate operating company which owns and operates a portfolio of 81 office properties totaling approximately 9.5 million leasable square feet located within 29 states. In addition, the Company owns a 20% equity interest in one Unconsolidated Joint Venture with an affiliate of Arch Street Capital Partners, which owns a portfolio consisting of six office properties totaling approximately 1.0 million leasable square feet located within six states. As of December 31, 2022, approximately 73.3% of the Company's Annualized Base Rent was from Investment Grade Tenants, the Company's Occupancy Rate was 89.0% and the Weighted Average Remaining Lease Term was 4.1 years.
The Company's Annualized Base Rent as of December 31, 2022 was approximately $159.4 million. See "Tenants Comprising Over 1% of Annualized Base Rent" below.
Tenants, Trademarks and Logos
Orion is not affiliated or associated with, is not endorsed by, does not endorse, and is not sponsored by or a sponsor of the tenants or of their products or services pictured or mentioned. The names, logos and all related product and service names, design marks and slogans are the trademarks or service marks of their respective companies.
See the Definitions section for a description of the Company's non-GAAP and operating metrics.
Orion Office REIT Inc. | WWW.ONLREIT.COM | 6
| | | | | | | | |
| | |
Q4 2022 SUPPLEMENTAL INFORMATION |
| | | | | | | | |
| Senior Management | | Board of Directors |
| | |
| Paul H. McDowell, Chief Executive Officer, President | | Reginald H. Gilyard, Non-Executive Chairman |
| | |
| Gavin B. Brandon, Executive Vice President, Chief Financial Officer and Treasurer | | Kathleen R. Allen, Ph.D., Independent Director |
| | |
| Paul C. Hughes, General Counsel and Secretary | | Richard J. Lieb, Independent Director |
| | |
| Christopher H. Day, Executive Vice President, Chief Operating Officer | | Gregory J. Whyte, Independent Director |
| | |
| Gary E. Landriau, Executive Vice President, Chief Investment Officer | | Paul H. McDowell, Chief Executive Officer, President and Director |
| | |
| Revea L. Schmidt, Senior Vice President, Chief Accounting Officer | | |
Corporate Offices and Contact Information
| | | | | | | | |
| 2398 E. Camelback Road, Suite 1060 | | 19 West 44th Street, Suite 1401 |
| Phoenix, AZ 85016 | | New York, NY 10036 |
| 602-698-1002 | | |
| www.ONLREIT.com | | |
Trading Symbol: ONL
Stock Exchange Listing: New York Stock Exchange
Transfer Agent
Computershare Trust Company, N.A.
462 South 4th Street, Suite 1600
Louisville, KY 40202
855-866- 0787
Orion Office REIT Inc. | WWW.ONLREIT.COM | 7
| | | | | | | | |
| | |
Q4 2022 SUPPLEMENTAL INFORMATION |
| | |
|
Balance Sheets (unaudited, in thousands) |
|
| | | | | | | | | | | | | | | | | | | | | | | | | | | | | | | | |
| | December 31, 2022 | | September 30, 2022 | | June 30, 2022 | | March 31, 2022 | | December 31, 2021 |
| Assets | | | | | | | | | | |
| Real estate investments, at cost: | | | | | | | | | | |
| Land | | $ | 238,225 | | | $ | 243,726 | | | $ | 250,724 | | | $ | 254,786 | | | $ | 250,194 | |
| Buildings, fixtures and improvements | | 1,128,400 | | | 1,137,177 | | | 1,208,475 | | | 1,231,469 | | | 1,231,551 | |
| Total real estate investments, at cost | | 1,366,625 | | | 1,380,903 | | | 1,459,199 | | | 1,486,255 | | | 1,481,745 | |
| Less: accumulated depreciation | | 133,379 | | | 126,097 | | | 138,642 | | | 137,217 | | | 128,109 | |
| Total real estate investments, net | | 1,233,246 | | | 1,254,806 | | | 1,320,557 | | | 1,349,038 | | | 1,353,636 | |
| Accounts receivable, net | | 21,641 | | | 21,923 | | | 25,731 | | | 22,032 | | | 17,916 | |
| Intangible lease assets, net | | 202,832 | | | 223,528 | | | 247,722 | | | 272,623 | | | 298,107 | |
| Cash and cash equivalents | | 20,638 | | | 23,282 | | | 19,300 | | | 18,585 | | | 29,318 | |
| Real estate assets held for sale, net | | 2,502 | | | 6,383 | | | 9,402 | | | — | | | — | |
| Other assets, net | | 90,214 | | | 91,632 | | | 91,208 | | | 92,671 | | | 60,501 | |
| Total assets | | $ | 1,571,073 | | | $ | 1,621,554 | | | $ | 1,713,920 | | | $ | 1,754,949 | | | $ | 1,759,478 | |
| | | | | | | | | | |
| Liabilities and Equity | | | | | | | | | | |
| Bridge facility, net | | $ | — | | | $ | — | | | $ | — | | | $ | — | | | $ | 354,357 | |
| Mortgages payable, net | | 352,167 | | | 351,994 | | | 351,820 | | | 351,648 | | | — | |
| Credit facility term loan, net | | 173,815 | | | 173,478 | | | 173,133 | | | 172,793 | | | 172,490 | |
| Credit facility revolver | | — | | | 31,000 | | | 71,000 | | | 91,000 | | | 90,000 | |
| Accounts payable and accrued expenses | | 26,161 | | | 22,038 | | | 16,855 | | | 17,929 | | | 17,379 | |
| Below-market lease liabilities, net | | 14,068 | | | 15,611 | | | 17,381 | | | 18,993 | | | 20,609 | |
| Distributions payable | | 5,664 | | | 5,664 | | | 5,663 | | | 5,663 | | | — | |
| Other liabilities, net | | 23,340 | | | 21,085 | | | 20,341 | | | 19,897 | | | 16,355 | |
| Total liabilities | | 595,215 | | | 620,870 | | | 656,193 | | | 677,923 | | | 671,190 | |
| | | | | | | | | | |
| | | | | | | | | | |
| Common stock | | 57 | | | 57 | | | 57 | | | 57 | | | 57 | |
| Additional paid-in capital | | 1,147,014 | | | 1,146,431 | | | 1,145,987 | | | 1,145,548 | | | 1,145,278 | |
| Accumulated other comprehensive income | | 6,308 | | | 7,057 | | | 5,851 | | | 4,356 | | | 299 | |
| Accumulated deficit | | (178,910) | | | (154,273) | | | (95,562) | | | (74,328) | | | (58,715) | |
| Total stockholders' equity | | 974,469 | | | 999,272 | | | 1,056,333 | | | 1,075,633 | | | 1,086,919 | |
| Non-controlling interest | | 1,389 | | | 1,412 | | | 1,394 | | | 1,393 | | | 1,369 | |
| Total equity | | 975,858 | | | 1,000,684 | | | 1,057,727 | | | 1,077,026 | | | 1,088,288 | |
| Total liabilities and equity | | $ | 1,571,073 | | | $ | 1,621,554 | | | $ | 1,713,920 | | | $ | 1,754,949 | | | $ | 1,759,478 | |
| | | | | | | | | | |
Orion Office REIT Inc. | WWW.ONLREIT.COM | 8
| | | | | | | | |
| | |
Q4 2022 SUPPLEMENTAL INFORMATION |
| | |
|
Statements of Operations (unaudited, in thousands, except per share data) |
|
| | | | | | | | | | | | | | | | | | | | | | | | | | | | | | | | |
| | Year Ended | | Three Months Ended |
| | December 31, 2022 | | December 31, 2022 | | September 30, 2022 | | June 30, 2022 | | March 31, 2022 |
| Revenues: | | | | | | | | | | |
| Rental | | $ | 207,353 | | | $ | 50,097 | | | $ | 51,580 | | | $ | 52,659 | | | $ | 53,017 | |
| Fee income from unconsolidated joint venture | | 765 | | | 197 | | | 189 | | | 190 | | | 189 | |
| Total revenues | | 208,118 | | | 50,294 | | | 51,769 | | | 52,849 | | | 53,206 | |
| Operating expenses: | | | | | | | | | | |
| Property operating | | 61,519 | | | 15,746 | | | 15,303 | | | 15,156 | | | 15,314 | |
| General and administrative | | 15,908 | | | 4,428 | | | 4,672 | | | 3,291 | | | 3,517 | |
| Depreciation and amortization | | 131,367 | | | 30,493 | | | 32,693 | | | 33,828 | | | 34,353 | |
| Impairments | | 66,359 | | | 12,198 | | | 44,801 | | | 7,758 | | | 1,602 | |
| Transaction related | | 675 | | | 277 | | | 194 | | | 141 | | | 63 | |
| Spin related | | 964 | | | — | | | — | | | 208 | | | 756 | |
| Total operating expenses | | 276,792 | | | 63,142 | | | 97,663 | | | 60,382 | | | 55,605 | |
| Other (expense) income: | | | | | | | | | | |
| Interest expense, net | | (30,171) | | | (7,553) | | | (7,904) | | | (7,867) | | | (6,847) | |
| Gain on disposition of real estate assets | | 2,352 | | | 1,293 | | | 1,059 | | | — | | | — | |
| Loss on extinguishment of debt, net | | (468) | | | — | | | — | | | — | | | (468) | |
| | | | | | | | | | |
| Other income, net | | 223 | | | 105 | | | 31 | | | 48 | | | 39 | |
| Equity in loss of unconsolidated joint venture | | (524) | | | (272) | | | (157) | | | (54) | | | (41) | |
| Total other (expenses) income, net | | (28,588) | | | (6,427) | | | (6,971) | | | (7,873) | | | (7,317) | |
| Loss before taxes | | (97,262) | | | (19,275) | | | (52,865) | | | (15,406) | | | (9,716) | |
| Provision for income taxes | | (212) | | | 282 | | | (164) | | | (164) | | | (166) | |
| Net loss | | (97,474) | | | (18,993) | | | (53,029) | | | (15,570) | | | (9,882) | |
| Net income attributable to non-controlling interest | | (20) | | | 23 | | | (18) | | | (1) | | | (24) | |
| Net loss attributable to common stockholders | | $ | (97,494) | | | $ | (18,970) | | | $ | (53,047) | | | $ | (15,571) | | | $ | (9,906) | |
| | | | | | | | | | |
| Weighted-average shares outstanding - basic and diluted | | 56,632 | | | 56,644 | | | 56,635 | | | 56,629 | | | 56,626 | |
| Basic and diluted net loss per share attributable to common stockholders | | $ | (1.72) | | | $ | (0.33) | | | $ | (0.94) | | | $ | (0.27) | | | $ | (0.17) | |
Orion Office REIT Inc. | WWW.ONLREIT.COM | 9
| | | | | | | | |
| | |
Q4 2022 SUPPLEMENTAL INFORMATION |
| | |
|
Funds From Operations (FFO), Core Funds From Operations (Core FFO) and Funds Available for Distribution (FAD) (unaudited, in thousands, except per share data) |
|
| | | | | | | | | | | | | | | | | | | | | | | | | | | | | | | | |
| | Year Ended | | Three Months Ended |
| | December 31, 2022 | | December 31, 2022 | | September 30, 2022 | | June 30, 2022 | | March 31, 2022 |
| Net loss | | $ | (97,494) | | | $ | (18,970) | | | $ | (53,047) | | | $ | (15,571) | | | $ | (9,906) | |
| Depreciation and amortization of real estate assets | | 131,297 | | | 30,475 | | | 32,674 | | | 33,811 | | | 34,337 | |
| Gain on disposition of real estate assets | | (2,352) | | | (1,293) | | | (1,059) | | | — | | | — | |
| Impairment of real estate | | 66,359 | | | 12,198 | | | 44,801 | | | 7,758 | | | 1,602 | |
| Proportionate share of Unconsolidated Joint Venture adjustments for items above, as applicable | | 1,847 | | | 465 | | | 460 | | | 461 | | | 461 | |
| FFO attributable to common stockholders | | $ | 99,657 | | | $ | 22,875 | | | $ | 23,829 | | | $ | 26,459 | | | $ | 26,494 | |
| Adjustments: | | | | | | | | | | |
| Transaction related expenses | | 675 | | | 277 | | | 194 | | | 141 | | | 63 | |
| Spin related expenses | | 964 | | | — | | | — | | | 208 | | | 756 | |
| | | | | | | | | | |
| Loss on extinguishment of debt, net | | 468 | | | — | | | — | | | — | | | 468 | |
| Core funds from operations attributable to common stockholders | | $ | 101,764 | | | $ | 23,152 | | | $ | 24,023 | | | $ | 26,808 | | | $ | 27,781 | |
| Adjustments: | | | | | | | | | | |
| Amortization of deferred financing costs | | 4,363 | | | 1,068 | | | 1,067 | | | 1,057 | | | 1,171 | |
| | | | | | | | | | |
| | | | | | | | | | |
| Amortization of above and below market leases, net | | (1,207) | | | (260) | | | (312) | | | (315) | | | (320) | |
| Amortization of deferred lease incentives | | 116 | | | 80 | | | 36 | | | — | | | — | |
| Straight-line rental revenue | | 769 | | | 2,911 | | | (699) | | | (547) | | | (896) | |
| Equity-based compensation | | 1,756 | | | 603 | | | 444 | | | 439 | | | 270 | |
| Equity in loss of Unconsolidated Joint Venture | | 524 | | | 272 | | | 157 | | | 54 | | | 41 | |
| Capital expenditures and leasing costs | | (14,624) | | | (6,112) | | | (3,730) | | | (2,381) | | | (2,401) | |
| Other adjustments, net | | 263 | | | 74 | | | 63 | | | 63 | | | 63 | |
| Proportionate share of Unconsolidated Joint Venture adjustments for the items above, as applicable | | (52) | | | (25) | | | (31) | | | (5) | | | 9 | |
| Funds available for distribution | | $ | 93,672 | | | $ | 21,763 | | | $ | 21,018 | | | $ | 25,173 | | | $ | 25,718 | |
| | | | | | | | | | |
| Weighted-average shares outstanding - basic and diluted | | 56,632 | | | 56,644 | | | 56,635 | | | 56,629 | | | 56,626 | |
| | | | | | | | | | |
FFO attributable to common stockholders per share | | $ | 1.76 | | | $ | 0.40 | | | $ | 0.42 | | | $ | 0.47 | | | $ | 0.47 | |
| Core FFO attributable to common stockholders per share | | $ | 1.80 | | | $ | 0.41 | | | $ | 0.42 | | | $ | 0.47 | | | $ | 0.49 | |
| FAD per share | | $ | 1.65 | | | $ | 0.38 | | | $ | 0.37 | | | $ | 0.44 | | | $ | 0.45 | |
See the Definitions section for a description of the Company's non-GAAP and operating metrics.
Orion Office REIT Inc. | WWW.ONLREIT.COM | 10
| | | | | | | | |
| | |
Q4 2022 SUPPLEMENTAL INFORMATION |
| | |
|
EBITDA, EBITDAre and Adjusted EBITDA (unaudited, in thousands) |
|
| | | | | | | | | | | | | | | | | | | | | | | | | | | | | | | | |
| | Year Ended | | Three Months Ended |
| | December 31, 2022 | | December 31, 2022 | | September 30, 2022 | | June 30, 2022 | | March 31, 2022 |
| Net loss | | $ | (97,494) | | | $ | (18,970) | | | $ | (53,047) | | | $ | (15,571) | | | $ | (9,906) | |
| Adjustments: | | | | | | | | | | |
| Interest expense | | 30,171 | | | 7,553 | | | 7,904 | | | 7,867 | | | 6,847 | |
| Depreciation and amortization | | 131,367 | | | 30,493 | | | 32,693 | | | 33,828 | | | 34,353 | |
| Provision for income taxes | | 212 | | | (282) | | | 164 | | | 164 | | | 166 | |
| Proportionate share of Unconsolidated Joint Venture adjustments for items above, as applicable | | 2,961 | | | 864 | | | 782 | | | 672 | | | 643 | |
| EBITDA | | $ | 67,217 | | | $ | 19,658 | | | $ | (11,504) | | | $ | 26,960 | | | $ | 32,103 | |
| Gain on disposition of real estate assets | | (2,352) | | | (1,293) | | | (1,059) | | | — | | | — | |
| Impairment of real estate | | 66,359 | | | 12,198 | | | 44,801 | | | 7,758 | | | 1,602 | |
| | | | | | | | | | |
| EBITDAre | | $ | 131,224 | | | $ | 30,563 | | | $ | 32,238 | | | $ | 34,718 | | | $ | 33,705 | |
| Transaction related | | 675 | | | 277 | | | 194 | | | 141 | | | 63 | |
| Spin related | | 964 | | | — | | | — | | | 208 | | | 756 | |
| Amortization of above and below market leases, net | | (1,207) | | | (260) | | | (312) | | | (315) | | | (320) | |
| Amortization of deferred lease incentives | | 116 | | | 80 | | | 36 | | | — | | | — | |
| Loss on extinguishment of debt, net | | 468 | | | — | | | — | | | — | | | 468 | |
| Proportionate share of Unconsolidated Joint Venture adjustments for items above, as applicable | | (30) | | | (8) | | | (7) | | | (8) | | | (7) | |
| Adjusted EBITDA | | $ | 132,210 | | | $ | 30,652 | | | $ | 32,149 | | | $ | 34,744 | | | $ | 34,665 | |
See the Definitions section for a description of the Company's non-GAAP and operating metrics.
Orion Office REIT Inc. | WWW.ONLREIT.COM | 11
| | | | | | | | |
| | |
Q4 2022 SUPPLEMENTAL INFORMATION |
| | |
|
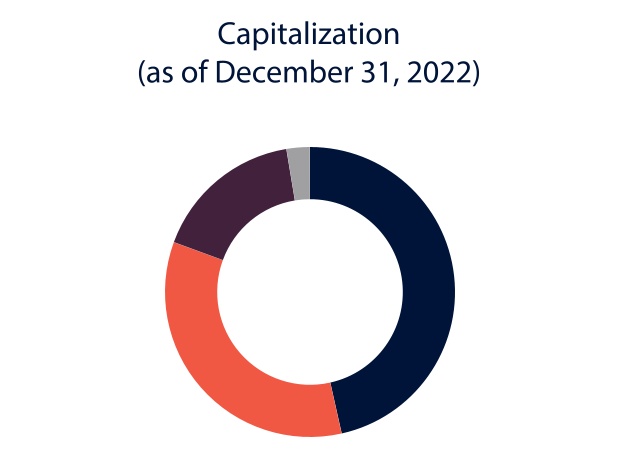
Capital Structure (unaudited, dollars and shares in thousands, except per share amounts) |
|
| | | | | | | | | | | |
| | Common equity | 46.5% |
| | | |
| | Mortgages payable, net | 34.1% |
| | | |
| | Credit facility term loan | 16.8% |
| | | |
| | Credit facility revolver (5) | —% |
| | | |
| | Proportionate share of Unconsolidated Joint Venture Debt | 2.6% |
Fixed vs. Variable Rate Debt
| | | | | |
| |
| Fixed and Swapped to Fixed | 100.0 | % |
Variable (5) | — | % |
| | | | | | | | | | | | | | | | | |
| Orion Capitalization Table | | |
| | | | | December 31, 2022 |
| Common stock outstanding | | | | 56,639 |
| Stock price | | | | | $ | 8.54 |
| Implied Equity Market Capitalization | | $ | 483,697 |
| | | | | |
| Wtd. Avg. Maturity
(Years) | | Interest Rate (1) | | December 31, 2022 |
Proportionate share of Unconsolidated Joint Venture Debt (2) | 1.9 | | 5.19 | % | | $ | 27,332 |
| Mortgages payable | 4.1 | | 4.97 | % | | 355,000 |
| Total secured debt | 4.0 | | 4.99 | % | | $ | 382,332 |
| | | | | |
Credit facility term loan (3) (4) | 0.9 | | 3.17 | % | | 175,000 |
Credit facility revolver (4) (5) | N/A | | N/A | | — |
| Total unsecured debt | 0.9 | | 3.17 | % | | 175,000 |
| | | | | |
| Total Principal Outstanding | 3.0 | | 4.42 | % | | $ | 557,332 |
| | | | | |
| Total Capitalization | | $ | 1,041,029 |
| Cash and cash equivalents | | 20,638 |
| Proportionate share of Unconsolidated Joint Venture cash and cash equivalents | | 572 |
| Enterprise Value | | $ | 1,019,819 |
| | |
| Net Debt/Enterprise Value | | 52.6 | % |
| Net Debt/Gross Real Estate Investments | | 30.7 | % |
| Fixed Charge Coverage Ratio | | 4.94x |
Liquidity (6) | | $ | 446,210 |
| Net Debt/Adjusted EBITDA | | 4.06x |
___________________________________
(1)Interest rate for variable rate debt represents the interest rate in effect as of December 31, 2022.
(2)The Unconsolidated Joint Venture mortgage notes payable have a floating interest rate, however, the Unconsolidated Joint Venture has entered into an interest rate swap transaction which effectively fixes the interest rate on the mortgage notes at 5.19% per annum.
(3)The credit facility term loan matures on November 12, 2023 and is a floating rate facility, however, the Company has entered into an interest rate swap transaction which effectively fixes the interest rate on the credit facility term loan indebtedness at 3.17% per annum.
(4)Under the related loan agreements, these borrowings which are secured only by a pledge of equity interests are treated as unsecured indebtedness. The Company's otherwise unencumbered properties are part of the unencumbered property pool under the related loan agreements and therefore, generally are not available to serve as collateral under other borrowings.
(5)The credit facility revolver matures on November 12, 2024 and had no outstanding draws as of December 31, 2022.
(6)Liquidity represents cash and cash equivalents of $21.2 million and $425.0 million available capacity on our $425.0 million credit facility revolver as of December 31, 2022.
See the Definitions section for a description of the Company's non-GAAP and operating metrics.
Orion Office REIT Inc. | WWW.ONLREIT.COM | 12
| | | | | | | | |
| | |
Q4 2022 SUPPLEMENTAL INFORMATION |
| | |
|
Debt Detail (unaudited, dollars in thousands) |
|
| | | | | | | | | | | | | | | | | | | | | | | | | | | | | | | | |
| Principal Payments Due | | Total | | 2023 | | 2024 | | 2025 | | Thereafter |
Credit facility revolver (1) | | $ | — | | | $ | — | | | $ | — | | | $ | — | | | $ | — | |
| Credit facility term loan | | 175,000 | | | 175,000 | | | — | | | — | | | — | |
| Mortgages payable | | 355,000 | | | — | | | — | | | — | | | 355,000 | |
| Proportionate share of Unconsolidated Joint Venture debt | | 27,332 | | | — | | | 27,332 | | | — | | | — | |
| Total Principal Outstanding | | $ | 557,332 | | | $ | 175,000 | | | $ | 27,332 | | | $ | — | | | $ | 355,000 | |
| | | | | | | | | | | | | | | | | | | | |
| Debt Type | | Percentage of Principal Outstanding | | Interest Rate | | Weighted-Average Years to Maturity |
Credit facility revolver (1) | | — | % | | N/A | | N/A |
| Credit facility term loan | | 31.4 | % | | 3.17 | % | | 0.9 |
| Mortgages payable | | 63.7 | % | | 4.97 | % | | 4.1 |
| Proportionate share of Unconsolidated Joint Venture debt | | 4.9 | % | | 5.19 | % | | 1.9 |
| Total | | 100.0 | % | | 4.42 | % | | 3.0 |
| | | | | | | | | | | | | | | | | | | | |
| Debt Type | | Percentage of Principal Outstanding | | Weighted-Average Interest Rate | | Weighted-Average Years to Maturity |
| Total unsecured debt | | 31.4 | % | | 3.17 | % | | 0.9 |
| Total secured debt | | 68.6 | % | | 4.99 | % | | 4.0 |
| Total | | 100.0 | % | | 4.42 | % | | 3.0 |
| | | | | | |
| Total fixed-rate and swapped to fixed-rate debt | | 100.0 | % | | 4.42 | % | | 3.0 |
Total variable-rate debt (1) | | — | % | | N/A | | N/A |
| Total | | 100.0 | % | | 4.42 | % | | 3.0 |
___________________________________
(1) The credit facility revolver matures on November 12, 2024 and had no outstanding draws as of December 31, 2022.
See the Definitions section for a description of the Company's non-GAAP and operating metrics.
Orion Office REIT Inc. | WWW.ONLREIT.COM | 13
| | | | | | | | |
| | |
Q4 2022 SUPPLEMENTAL INFORMATION |
| | |
|
Ratio Analysis (unaudited, dollars in thousands) |
|
| | | | | | | | | | | | | | | | | | | | | | | | | | | | | | | | |
| | Year Ended | | Three Months Ended |
| | December 31, 2022 | | December 31, 2022 | | September 30, 2022 | | June 30, 2022 | | March 31, 2022 |
| Interest Coverage Ratio | | | | | | | | | | |
Interest Expense, excluding non-cash amortization (1) | | $ | 26,739 | | $ | 6,852 | | $ | 7,131 | | $ | 6,965 | | $ | 5,791 |
Adjusted EBITDA (2) | | 132,210 | | 30,652 | | 32,149 | | 34,744 | | 34,665 |
| Interest Coverage Ratio | | 4.94x | | 4.47x | | 4.51x | | 4.99x | | 5.99x |
| | | | | | | | | | |
| Fixed Charge Coverage Ratio | | | | | | | | | | |
Interest Expense, excluding non-cash amortization (1) | | $ | 26,739 | | $ | 6,852 | | $ | 7,131 | | $ | 6,965 | | $ | 5,791 |
| Secured debt principal amortization | | — | | — | | — | | — | | — |
| Total fixed charges | | 26,739 | | 6,852 | | 7,131 | | 6,965 | | 5,791 |
Adjusted EBITDA (2) | | 132,210 | | 30,652 | | 32,149 | | 34,744 | | 34,665 |
| Fixed Charge Coverage Ratio | | 4.94x | | 4.47x | | 4.51x | | 4.99x | | 5.99x |
___________________________________
(1)Refer to the Statements of Operations section for interest expense calculated in accordance with GAAP and to the Definitions section for the required reconciliation to the most directly comparable GAAP financial measure.
(2)Refer to the Statements of Operations section for net income calculated in accordance with GAAP and to the EBITDAre and Adjusted EBITDA section for the required reconciliation to the most directly comparable GAAP financial measure.
| | | | | | | | | | | | | | | | | | | | | | | | | | |
| | December 31, 2022 | | September 30, 2022 | | June 30, 2022 | | March 31, 2022 |
| Net Debt Ratios | | | | | | | | |
Net Debt (1) | | $ | 536,122 | | $ | 564,292 | | $ | 608,409 | | $ | 629,095 |
Adjusted EBITDA (2) | | 132,210 | | 128,596 | | 138,976 | | 138,660 |
| Net Debt to Adjusted EBITDA ratio | | 4.06x | | 4.39x | | 4.38x | | 4.54x |
| | | | | | | | |
Net Debt (1) | | $ | 536,122 | | $ | 564,292 | | $ | 608,409 | | $ | 629,095 |
Gross Real Estate Investments (1) | | 1,743,969 | | 1,766,600 | | 1,850,068 | | 1,867,581 |
| Net Debt Leverage Ratio | | 30.7 | % | | 31.9 | % | | 32.9 | % | | 33.7 | % |
| | | | | | | | |
| Unencumbered Assets/Real Estate Assets | | | | | | | | |
Unencumbered Gross Real Estate Investments (1) | | $ | 1,141,035 | | $ | 1,165,310 | | $ | 1,249,379 | | $ | 1,267,128 |
Gross Real Estate Investments (1) | | 1,743,969 | | 1,766,600 | | 1,850,068 | | 1,867,581 |
| Unencumbered Asset Ratio | | 65.4 | % | | 66.0 | % | | 67.5 | % | | 67.8 | % |
___________________________________
(1)Refer to the Balance Sheets section for total debt and real estate investments, at cost calculated in accordance with GAAP and to the Definitions section for the required reconciliation to the most directly comparable GAAP financial measure.
(2)Adjusted EBITDA for the year ended December 31, 2022 has not been annualized for the purpose of this calculation. Adjusted EBITDA for the quarters ended September 30, 2022, June 30, 2022 and March 31, 2022 has been annualized for the purpose of this calculation.
See the Definitions section for a description of the Company's non-GAAP and operating metrics.
Orion Office REIT Inc. | WWW.ONLREIT.COM | 14
| | | | | | | | |
| | |
Q4 2022 SUPPLEMENTAL INFORMATION |
| | |
|
Credit Facility Covenants (unaudited) |
|
The following is a summary of financial covenants for the Company's credit facility term loan and credit facility revolver as defined and calculated per the terms of the facility's credit agreement. These calculations are presented to investors to show the Company's compliance with the financial covenants and are not measures of our liquidity or performance. As of December 31, 2022, the Company believes it is in compliance with these covenants based on the covenant limits and calculations in place at that time.
| | | | | | | | | | | | | | |
| Credit Facility Financial Covenants | | Required | | December 31, 2022 |
| Ratio of total indebtedness to total asset value | | ≤ 60% | | 29.0% |
| Ratio of adjusted EBITDA to fixed charges | | ≥ 1.5x | | 4.94x |
| Ratio of secured indebtedness to total asset value | | ≤ 45% | | 19.8% |
| Ratio of unsecured indebtedness to unencumbered asset value | | ≤ 60% | | 12.8% |
| Ratio of unencumbered adjusted NOI to unsecured interest expense | | ≥ 2.00x | | 13.32x |
See the Definitions section for a description of the Company's non-GAAP and operating metrics.
Orion Office REIT Inc. | WWW.ONLREIT.COM | 15
| | | | | | | | |
| | |
Q4 2022 SUPPLEMENTAL INFORMATION |
| | |
|
Net Operating Income (NOI) and Cash NOI (unaudited, dollars in thousands) |
|
| | | | | | | | | | | | | | | | | | | | | | | | | | | | | | | | |
| | Year Ended | | Three Months Ended |
| | December 31, 2022 | | December 31, 2022 | | September 30, 2022 | | June 30, 2022 | | March 31, 2022 |
| Rental revenue | | $ | 207,353 | | | $ | 50,097 | | | $ | 51,580 | | | $ | 52,659 | | | $ | 53,017 | |
| Property operating expense | | (61,519) | | | (15,746) | | | (15,303) | | | (15,156) | | | (15,314) | |
| NOI | | 145,834 | | | 34,351 | | | 36,277 | | | 37,503 | | | 37,703 | |
| Adjustments: | | | | | | | | | | |
| Straight-line rent | | 769 | | | 2,911 | | | (699) | | | (547) | | | (896) | |
| Amortization of above and below market leases, net | | (1,207) | | | (260) | | | (312) | | | (315) | | | (320) | |
| Amortization of deferred lease incentives | | 116 | | | 80 | | | 36 | | | — | | | — | |
| Other non-cash adjustments | | 200 | | | 51 | | | 50 | | | 48 | | | 51 | |
| Proportionate share of Unconsolidated Joint Venture NOI | | 3,380 | | | 833 | | | 848 | | | 850 | | | 849 | |
| Cash NOI | | $ | 149,092 | | | $ | 37,966 | | | $ | 36,200 | | | $ | 37,539 | | | $ | 37,387 | |
See the Definitions section for a description of the Company's non-GAAP and operating metrics.
Orion Office REIT Inc. | WWW.ONLREIT.COM | 16
| | | | | | | | |
| | |
Q4 2022 SUPPLEMENTAL INFORMATION |
| | |
|
Leasing Activity (unaudited, dollars and square feet in thousands) |
|
During the quarter and year ended December 31, 2022, we entered into new and renewal leases as summarized in the following tables:
| | | | | | | | | | | | | | | | | | | | |
| | Three Months Ended December 31, 2022 |
| | New Leases | | Renewals | | Total |
| Rentable square feet leased | | 78 | | | 307 | | 385 |
Weighted average rental rate change (cash basis) (1) (2) | | (6.0) | % | | 22.7 | % | | 14.1 | % |
Tenant leasing costs and concession commitments (3) | | $ | 1,517 | | | $ | 18,048 | | | $ | 19,565 | |
| Tenant leasing costs and concession commitments per rentable square foot | | $ | 19.35 | | | $ | 58.88 | | | $ | 50.82 | |
| Weighted average lease term (by rentable square feet) (years) | | 5.4 | | 8.5 | | 7.9 |
| Tenant leasing costs and concession commitments per rentable square foot per year | | $ | 3.57 | | | $ | 6.94 | | | $ | 6.47 | |
| | | | | | | | | | | | | | | | | | | | |
| | Year Ended December 31, 2022 |
| | New Leases | | Renewals | | Total |
| Rentable square feet leased | | 119 | | 686 | | 805 |
Weighted average rental rate change (cash basis) (1) (2) | | (6.0) | % | | 5.7 | % | | 4.1 | % |
Tenant leasing costs and concession commitments (3) | | $ | 4,237 | | | $ | 25,874 | | | $ | 30,111 | |
| Tenant leasing costs and concession commitments per rentable square foot | | $ | 35.53 | | | $ | 37.73 | | | $ | 37.41 | |
| Weighted average lease term (by rentable square feet) (years) | | 7.3 | | 7.2 | | 7.3 |
| Tenant leasing costs and concession commitments per rentable square foot per year | | $ | 4.85 | | | $ | 5.21 | | | $ | 5.16 | |
____________________________________(1)Represents weighted average percentage increase or decrease in (i) the annualized monthly cash amount charged to the applicable tenants (including monthly base rent receivables and certain contractually obligated reimbursements by the applicable tenants, which may include estimates) as of the commencement date of the new lease term (excluding any full or partial rent abatement period) compared to (ii) the annualized monthly cash amount charged to the applicable tenants (including the monthly base rent receivables and certain contractually obligated reimbursements by the applicable tenants, which may include estimates) as of the expiration date of the prior lease term. If a space has been vacant for more than 12 months prior to the execution of a new lease, the lease will be excluded from this calculation.
(2)Excludes one new lease for approximately 41,000 square feet of space that had been vacant for more than 12 months at the time the new lease was executed.
(3)Includes commitments for tenant improvement allowances and base building allowances, leasing commissions and free rent (includes estimates of property operating expenses, where applicable).
See the Definitions section for a description of the Company's non-GAAP and operating metrics.
Orion Office REIT Inc. | WWW.ONLREIT.COM | 17
| | | | | | | | |
| | |
Q4 2022 SUPPLEMENTAL INFORMATION |
| | |
|
Dispositions (unaudited, square feet and dollars in thousands) |
|
The following table summarizes the Company's disposition activity during the year ended December 31, 2022.
| | | | | | | | | | | | | | | | | | | | | | | | | | |
| Date Sold | | Property Location | | Square Feet | | Gross Sale Price | | Lease Term (Years)(1) |
| 5/31/2022 | | Annandale, NJ | | 105 | | $3,600 | | 0.2 |
| 7/8/2022 | | Buffalo Grove, IL | | 105 | | 6,280 | | Vacant |
| 8/4/2022 | | Dublin, OH | | 150 | | 7,250 | | Vacant |
| 8/18/2022 | | Ponce, PR | | 57 | | 2,850 | | 0.5 |
| 8/19/2022 | | Harleysville, PA | | 80 | | 3,150 | | 0.4 |
| 10/11/2022 | | Sierra Vista, AZ | | 24 | | 2,300 | | Vacant |
| 11/1/2022 | | El Centro, CA | | 18 | | 3,010 | | Vacant |
| 11/8/2022 | | Ridley Park, PA | | 23 | | 209 | | Vacant |
| 12/19/2022 | | Schaumburg, IL | | 107 | | 1,200 | | Vacant |
| 12/21/2022 | | Northbrook, IL | | 195 | | 2,250 | | Vacant |
| 12/23/2022 | | Cedar Falls, IA | | 45 | | 1,000 | | Vacant |
| Total | | 909 | | $33,099 | | |
____________________________________
(1)Represents the remaining lease term from the date of sale.
See the Definitions section for a description of the Company's non-GAAP and operating metrics.
Orion Office REIT Inc. | WWW.ONLREIT.COM | 18
| | | | | | | | |
| | |
Q4 2022 SUPPLEMENTAL INFORMATION |
| | |
|
Diversification Statistics: Real Estate Portfolio (unaudited, percentages based on portfolio Annualized Base Rent as of December 31, 2022, other than occupancy rate which is based on square footage as of December 31, 2022) |
|
___________________________________________________
___________________________________________________
___________________________________________________
___________________________________________________
| | | | | | | | |
Statistics (square feet in thousands) |
| | |
| Operating Properties | | 81 | |
| Unconsolidated Joint Venture Properties | | 6 | |
| Rentable Square Feet | | 9,732 | |
| Occupancy Rate | | 89.0 | % |
| Weighted Average Remaining Lease Term | | 4.1 | |
| Investment-Grade Tenants | | 73.3 | % |
| | |
| NN leases | | 66.8 | % |
| NNN leases | | 16.6 | % |
See the Definitions section for a description of the Company's non-GAAP and operating metrics.
Orion Office REIT Inc. | WWW.ONLREIT.COM | 19
| | | | | | | | |
| | |
| Q4 2022 SUPPLEMENTAL INFORMATION |
| | |
|
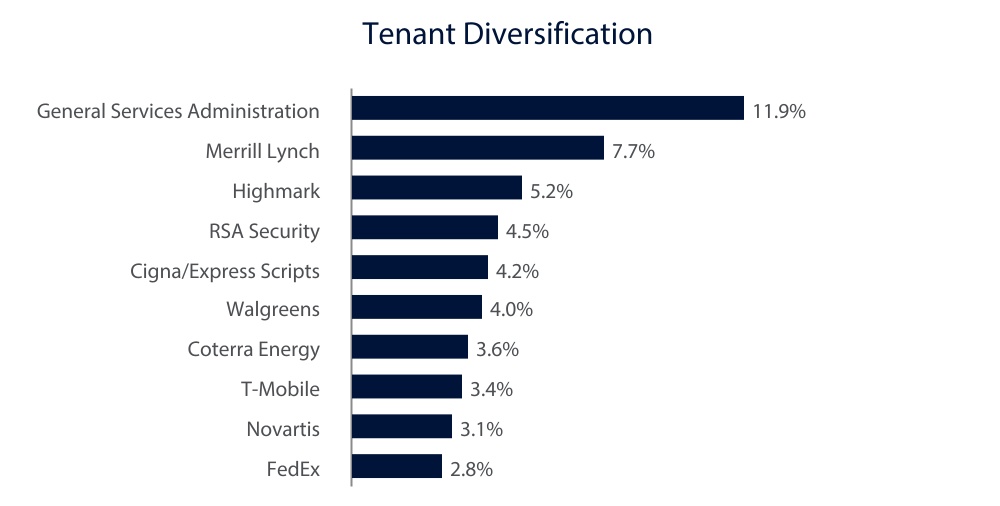
Tenants Comprising Over 1% of Annualized Base Rent (unaudited, square feet and dollars in thousands as of December 31, 2022) |
|
| | | | | | | | | | | | | | | | | | | | | | | | | | | | | | | | | | | | | | |
| Tenant | | Number of Leases | | Leased Square Feet | | Square Feet as a % of Total Portfolio | | Annualized Base Rent | | Annualized Base Rent as a % of Total Portfolio | | Credit Rating |
| General Services Administration | | 17 | | | 782 | | | 8.0 | % | | $ | 18,950 | | | 11.9 | % | | AA+ |
| Merrill Lynch | | 1 | | | 482 | | | 5.0 | % | | 12,224 | | | 7.7 | % | | A- |
| Highmark Western & Northeastern NY | | 1 | | | 430 | | | 4.4 | % | | 8,328 | | | 5.2 | % | | NR |
| RSA Security | | 2 | | | 328 | | | 3.4 | % | | 7,221 | | | 4.5 | % | | BBB |
| Cigna/Express Scripts | | 3 | | | 365 | | | 3.7 | % | | 6,765 | | | 4.2 | % | | A- |
| Walgreens | | 6 | | | 574 | | | 5.9 | % | | 6,310 | | | 4.0 | % | | BBB |
| Coterra Energy | | 1 | | | 309 | | | 3.2 | % | | 5,658 | | | 3.6 | % | | BBB |
| T-Mobile | | 4 | | | 294 | | | 3.0 | % | | 5,431 | | | 3.4 | % | | BBB- |
| Novartis | | 1 | | | 176 | | | 1.8 | % | | 4,995 | | | 3.1 | % | | AA- |
| FedEx | | 2 | | | 352 | | | 3.6 | % | | 4,469 | | | 2.8 | % | | BBB |
| Top Ten Tenants | | 38 | | | 4,092 | | | 42.0 | % | | 80,351 | | | 50.4 | % | | |
| Remaining Tenants: | | | | | | | | | | | | |
| MDC Holdings Inc. | | 1 | | | 144 | | | 1.5 | % | | 4,299 | | | 2.7 | % | | BBB- |
| Charter Communications | | 2 | | | 264 | | | 2.7 | % | | 3,689 | | | 2.3 | % | | BB+ |
| Banner Life Insurance | | 1 | | | 116 | | | 1.2 | % | | 3,493 | | | 2.2 | % | | A |
| Inform Diagnostics | | 1 | | | 172 | | | 1.8 | % | | 3,481 | | | 2.2 | % | | NR |
| Encompass Health | | 1 | | | 65 | | | 0.7 | % | | 3,436 | | | 2.2 | % | | BB- |
| Collins Aerospace | | 1 | | | 207 | | | 2.1 | % | | 3,300 | | | 2.1 | % | | A- |
| Home Depot/HD Supply | | 2 | | | 153 | | | 1.6 | % | | 3,109 | | | 2.0 | % | | A |
| Experian | | 1 | | | 178 | | | 1.8 | % | | 2,988 | | | 1.9 | % | | A- |
| AAA | | 1 | | | 147 | | | 1.5 | % | | 2,904 | | | 1.8 | % | | NR |
| AT&T | | 1 | | | 203 | | | 2.1 | % | | 2,820 | | | 1.8 | % | | BBB |
| Linde | | 1 | | | 161 | | | 1.7 | % | | 2,540 | | | 1.6 | % | | A |
| Citigroup | | 1 | | | 64 | | | 0.7 | % | | 2,364 | | | 1.5 | % | | BBB+ |
| CVS/Aetna | | 1 | | | 127 | | | 1.3 | % | | 2,259 | | | 1.4 | % | | BBB |
| Hasbro | | 1 | | | 136 | | | 1.4 | % | | 2,243 | | | 1.4 | % | | BBB |
| Ingram Micro | | 1 | | | 200 | | | 2.1 | % | | 2,197 | | | 1.4 | % | | BB- |
| Novus International | | 1 | | | 96 | | | 1.0 | % | | 2,022 | | | 1.3 | % | | NR |
| Elementis | | 1 | | | 66 | | | 0.7 | % | | 1,980 | | | 1.2 | % | | NR |
| Maximus | | 2 | | | 196 | | | 2.0 | % | | 1,971 | | | 1.2 | % | | BB+ |
| NetJets | | 1 | | | 140 | | | 1.4 | % | | 1,966 | | | 1.2 | % | | NR |
| Pulte Mortgage | | 1 | | | 95 | | | 1.0 | % | | 1,953 | | | 1.2 | % | | BBB- |
| Baker Hughes | | 1 | | | 152 | | | 1.6 | % | | 1,663 | | | 1.0 | % | | A- |
| Abbott Laboratories | | 1 | | | 131 | | | 1.3 | % | | 1,609 | | | 1.0 | % | | AA- |
| AGCO | | 1 | | | 126 | | | 1.3 | % | | 1,607 | | | 1.0 | % | | BBB- |
| | | | | | | | | | | | |
| | | | | | | | | | | | |
| | | | | | | | | | | | |
| | | | | | | | | | | | |
| | | | | | | | | | | | |
| | | | | | | | | | | | |
| | | | | | | | | | | | |
| | | | | | | | | | | | |
| | | | | | | | | | | | |
| | | | | | | | | | | | |
| | | | | | | | | | | | |
| | | | | | | | | | | | |
| | | | | | | | | | | | |
| | | | | | | | | | | | |
| Total | | 64 | | | 7,431 | | | 76.5 | % | | $ | 140,244 | | | 88.0 | % | | |
See the Definitions section for a description of the Company's non-GAAP and operating metrics.
Orion Office REIT Inc. | WWW.ONLREIT.COM | 20
| | | | | | | | |
| | |
| Q4 2022 SUPPLEMENTAL INFORMATION |
| | |
|
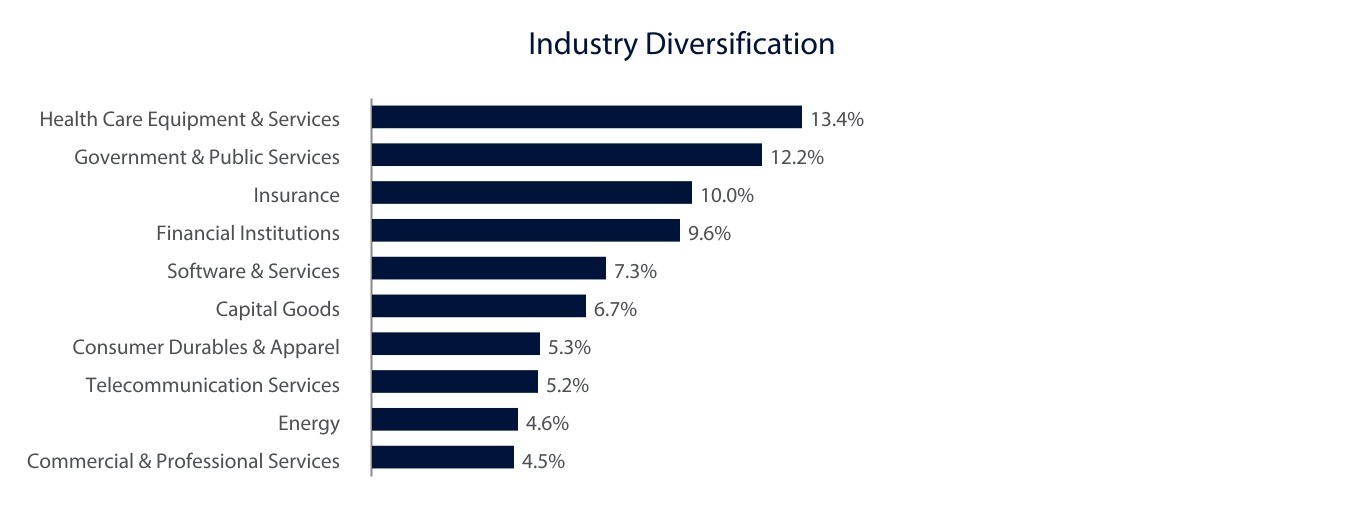
Diversification: Tenant Industry (unaudited, square feet and dollars in thousands as of December 31, 2022) |
|
| | | | | | | | | | | | | | | | | | | | | | | | | | | | | | | | |
| Industry | | Number of Leases (1) | | Leased Square Feet | | Leased Square Feet as a % of Total Portfolio | | Annualized Base Rent | | Annualized Base Rent as a % of Total Portfolio |
| Health Care Equipment & Services | | 12 | | | 1,109 | | | 11.4 | % | | $ | 21,379 | | | 13.4 | % |
| Government & Public Services | | 19 | | | 826 | | | 8.5 | % | | 19,498 | | | 12.2 | % |
| Insurance | | 4 | | | 747 | | | 7.7 | % | | 15,959 | | | 10.0 | % |
| Financial Institutions | | 3 | | | 616 | | | 6.3 | % | | 15,373 | | | 9.6 | % |
| Software & Services | | 6 | | | 638 | | | 6.6 | % | | 11,639 | | | 7.3 | % |
| Capital Goods | | 9 | | | 693 | | | 7.1 | % | | 10,739 | | | 6.7 | % |
| Consumer Durables & Apparel | | 3 | | | 375 | | | 3.9 | % | | 8,495 | | | 5.3 | % |
| Telecommunication Services | | 6 | | | 497 | | | 5.1 | % | | 8,251 | | | 5.2 | % |
| Energy | | 2 | | | 461 | | | 4.7 | % | | 7,321 | | | 4.6 | % |
| Commercial & Professional Services | | 10 | | | 505 | | | 5.2 | % | | 7,205 | | | 4.5 | % |
| Top Ten Tenant Industries | | 74 | | | 6,467 | | | 66.5 | % | | 125,859 | | | 78.8 | % |
| Remaining Tenant Industries: | | | | | | | | | | |
| Transportation | | 5 | | | 541 | | | 5.6 | % | | 7,183 | | | 4.5 | % |
| Food & Staples Retailing | | 6 | | | 574 | | | 5.9 | % | | 6,310 | | | 4.0 | % |
| Materials | | 4 | | | 352 | | | 3.6 | % | | 5,655 | | | 3.6 | % |
| Pharmaceuticals, Biotechnology & Life Sciences | | 1 | | | 176 | | | 1.8 | % | | 4,995 | | | 3.1 | % |
| Media & Entertainment | | 2 | | | 264 | | | 2.7 | % | | 3,689 | | | 2.3 | % |
| Retailing | | 3 | | | 157 | | | 1.6 | % | | 3,181 | | | 2.0 | % |
| Food, Beverage & Tobacco | | 1 | | | 96 | | | 1.0 | % | | 2,022 | | | 1.3 | % |
| Utilities | | 1 | | | 25 | | | 0.3 | % | | 394 | | | 0.3 | % |
| Real Estate | | 1 | | | 4 | | | — | % | | 86 | | | 0.1 | % |
| Consumer Services | | 2 | | | 5 | | | — | % | | 54 | | | — | % |
| Total | | 100 | | | 8,661 | | | 89.0 | % | | $ | 159,428 | | | 100.0 | % |
__________________________________
(1) The Company has certain properties that are subject to multiple leases.
See the Definitions section for a description of the Company's non-GAAP and operating metrics.
Orion Office REIT Inc. | WWW.ONLREIT.COM | 21
| | | | | | | | |
| | |
| Q4 2022 SUPPLEMENTAL INFORMATION |
| | |
|
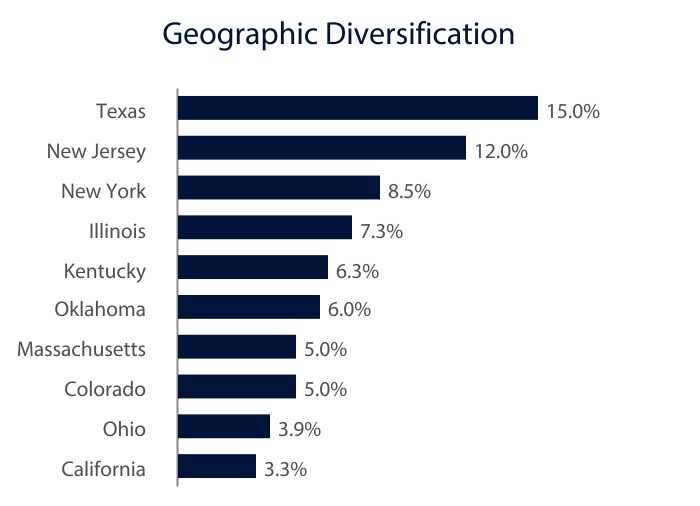
Diversification: Property Geographic (unaudited, square feet and dollars in thousands as of December 31, 2022) |
|
| | | | | | | | | | | | | | | | | | | | | | | | | | | | | | | | |
| Location | | Number of Properties | | Rentable Square Feet | | Square Feet as a % of Total Portfolio | | Annualized Base Rent | | Annualized Base Rent as a % of Total Portfolio |
| Texas | | 15 | | | 1,353 | | | 13.9 | % | | $ | 23,831 | | | 15.0 | % |
| New Jersey | | 3 | | | 724 | | | 7.4 | % | | 19,199 | | | 12.0 | % |
| New York | | 5 | | | 781 | | | 8.0 | % | | 13,564 | | | 8.5 | % |
| Illinois | | 9 | | | 916 | | | 9.4 | % | | 11,702 | | | 7.3 | % |
| Kentucky | | 2 | | | 458 | | | 4.7 | % | | 10,114 | | | 6.3 | % |
| Oklahoma | | 3 | | | 585 | | | 6.0 | % | | 9,591 | | | 6.0 | % |
| Massachusetts | | 2 | | | 378 | | | 3.9 | % | | 7,933 | | | 5.0 | % |
| Colorado | | 4 | | | 570 | | | 5.9 | % | | 7,915 | | | 5.0 | % |
| Ohio | | 4 | | | 500 | | | 5.1 | % | | 6,212 | | | 3.9 | % |
| California | | 3 | | | 244 | | | 2.5 | % | | 5,299 | | | 3.3 | % |
| Top Ten States | | 50 | | | 6,509 | | | 66.8 | % | | 115,360 | | | 72.3 | % |
| Remaining States: | | | | | | | | | | |
| Missouri | | 4 | | | 529 | | | 5.4 | % | | 4,868 | | | 3.1 | % |
| Georgia | | 3 | | | 284 | | | 2.9 | % | | 4,601 | | | 2.9 | % |
| Maryland | | 2 | | | 236 | | | 2.4 | % | | 4,537 | | | 2.9 | % |
| Tennessee | | 4 | | | 240 | | | 2.5 | % | | 4,527 | | | 2.8 | % |
| Virginia | | 2 | | | 240 | | | 2.5 | % | | 4,426 | | | 2.8 | % |
| Rhode Island | | 2 | | | 206 | | | 2.1 | % | | 3,028 | | | 1.9 | % |
| South Carolina | | 1 | | | 64 | | | 0.7 | % | | 2,364 | | | 1.5 | % |
| Wisconsin | | 1 | | | 155 | | | 1.6 | % | | 2,243 | | | 1.4 | % |
| Arizona | | 2 | | | 215 | | | 2.2 | % | | 2,216 | | | 1.4 | % |
| Kansas | | 2 | | | 196 | | | 2.0 | % | | 1,971 | | | 1.2 | % |
| Iowa | | 2 | | | 92 | | | 0.9 | % | | 1,911 | | | 1.2 | % |
| Nebraska | | 2 | | | 180 | | | 1.9 | % | | 1,553 | | | 1.0 | % |
| Pennsylvania | | 2 | | | 233 | | | 2.4 | % | | 1,287 | | | 0.8 | % |
| Oregon | | 1 | | | 69 | | | 0.7 | % | | 1,120 | | | 0.7 | % |
| West Virginia | | 1 | | | 64 | | | 0.7 | % | | 1,114 | | | 0.7 | % |
| Idaho | | 2 | | | 45 | | | 0.5 | % | | 1,027 | | | 0.6 | % |
| Indiana | | 1 | | | 83 | | | 0.9 | % | | 557 | | | 0.4 | % |
| Minnesota | | 1 | | | 39 | | | 0.4 | % | | 493 | | | 0.3 | % |
| Florida | | 2 | | | 53 | | | 0.5 | % | | 225 | | | 0.1 | % |
| Total | | 87 | | | 9,732 | | | 100.0 | % | | $ | 159,428 | | | 100.0 | % |
See the Definitions section for a description of the Company's non-GAAP and operating metrics.
Orion Office REIT Inc. | WWW.ONLREIT.COM | 22
| | | | | | | | |
| | |
| Q4 2022 SUPPLEMENTAL INFORMATION |
| | |
|
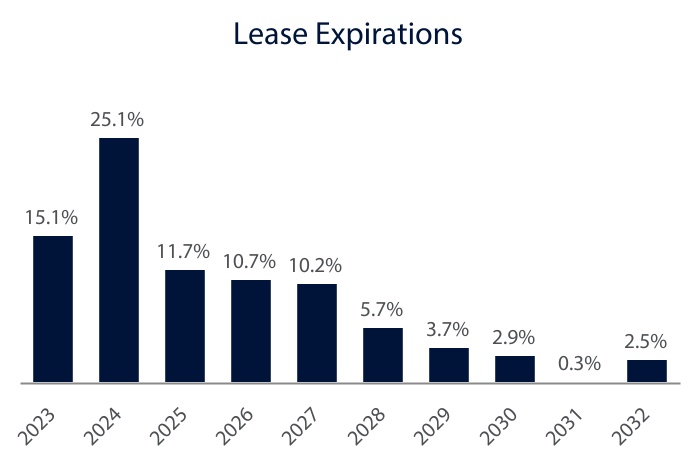
Lease Expirations (unaudited, square feet and dollars in thousands as of December 31, 2022) |
|
| | | | | | | | | | | | | | | | | | | | | | | | | | | | | | | | |
| Year of Expiration | | Number of Leases
Expiring (1) | | Leased
Square Feet | | Leased Square Feet as a % of Total Portfolio | | Annualized Base Rent | | Annualized Base Rent as a % of Total Portfolio |
| 2023 | | 15 | | | 1,575 | | | 16.2 | % | | $ | 24,142 | | | 15.1 | % |
| 2024 | | 16 | | | 1,971 | | | 20.3 | % | | 39,972 | | | 25.1 | % |
| 2025 | | 13 | | | 1,049 | | | 10.8 | % | | 18,686 | | | 11.7 | % |
| 2026 | | 13 | | | 757 | | | 7.8 | % | | 17,134 | | | 10.7 | % |
| 2027 | | 14 | | | 1,002 | | | 10.3 | % | | 16,206 | | | 10.2 | % |
| 2028 | | 9 | | | 513 | | | 5.3 | % | | 9,093 | | | 5.7 | % |
| 2029 | | 4 | | | 396 | | | 4.1 | % | | 5,846 | | | 3.7 | % |
| 2030 | | 2 | | | 98 | | | 1.0 | % | | 4,564 | | | 2.9 | % |
| 2031 | | 1 | | | 11 | | | 0.1 | % | | 427 | | | 0.3 | % |
| 2032 | | 3 | | | 300 | | | 3.1 | % | | 4,004 | | | 2.5 | % |
| Thereafter | | 8 | | | 932 | | | 9.4 | % | | 19,069 | | | 11.9 | % |
| Subtotal | | 98 | | | 8,604 | | | 88.4 | % | | 159,143 | | | 99.8 | % |
| Month-to-Month | | 2 | | | 57 | | | 0.6 | % | | 285 | | | 0.2 | % |
| Total | | 100 | | | 8,661 | | | 89.0 | % | | $ | 159,428 | | | 100.0 | % |
__________________________________
(1) The Company has certain properties that are subject to multiple leases.
See the Definitions section for a description of the Company's non-GAAP and operating metrics.
Orion Office REIT Inc. | WWW.ONLREIT.COM | 23
| | | | | | | | |
| | |
| Q4 2022 SUPPLEMENTAL INFORMATION |
| | |
|
Lease Summary (unaudited, square feet and dollars in thousands as of December 31, 2022) |
|
Rent Escalations
| | | | | | | | | | | | | | | | | | | | | | | | | | | | | | | | |
| | Number of Leases (1) | | Leased
Square Feet | | Leased Square Feet as a % of Total Portfolio | | Annualized Base Rent | | Annualized Base Rent as a % of Total Portfolio |
| Fixed Dollar or Percent Increase | | 74 | | | 7,293 | | | 74.9 | % | | $ | 131,945 | | | 82.8 | % |
| Flat | | 8 | | | 476 | | | 4.9 | % | | 5,495 | | | 3.4 | % |
| GSA CPI | | 14 | | | 690 | | | 7.1 | % | | 17,923 | | | 11.2 | % |
| CPI | | 2 | | | 145 | | | 1.5 | % | | 3,780 | | | 2.4 | % |
| Month-to-Month | | 2 | | | 57 | | | 0.6 | % | | 285 | | | 0.2 | % |
| Total | | 100 | | | 8,661 | | | 89.0 | % | | $ | 159,428 | | | 100.0 | % |
Tenant Expense Obligation
| | | | | | | | | | | | | | | | | | | | | | | | | | | | | | | | |
| | Number of Leases (1) | | Leased
Square Feet | | Leased Square Feet as a % of Total Portfolio | | Annualized Base Rent | | Annualized Base Rent as a % of Total Portfolio |
| NN | | 59 | | | 5,828 | | | 59.9 | % | | $ | 106,456 | | | 66.8 | % |
| Modified Gross | | 19 | | | 978 | | | 10.0 | % | | 26,355 | | | 16.5 | % |
| NNN | | 19 | | | 1,847 | | | 19.0 | % | | 26,522 | | | 16.6 | % |
| Gross | | 3 | | | 8 | | | 0.1 | % | | 95 | | | 0.1 | % |
| Total | | 100 | | | 8,661 | | | 89.0 | % | | $ | 159,428 | | | 100.0 | % |
__________________________________
(1) The Company has certain properties that are subject to multiple leases.
See the Definitions section for a description of the Company's non-GAAP and operating metrics.
Orion Office REIT Inc. | WWW.ONLREIT.COM | 24
| | | | | | | | |
| | |
| Q4 2022 SUPPLEMENTAL INFORMATION |
| | | | | | | | | | | | | | | | | | | | | | | | |
| | | | Industry | | Address | | City | | State |
| | | | Food, Beverage & Tobacco | | 20 Missouri Research Park Drive | | St. Charles | | MO |
| | | | Telecommunication Services | | 4335 Paredes Line Road | | Brownsville | | TX |
| | | | Telecommunication Services | | 3750 Wheeler Road | | Augusta | | GA |
| | | | Telecommunication Services | | 4080 27th Court SE | | Salem | | OR |
| | | | Financial Institutions | | 11 Ewall Street | | Mount Pleasant | | SC |
| | | | Health Care Equipment & Services | | 8455 University Place Drive | | St. Louis | | MO |
| | | | Transportation | | 1475 Boettler Road | | Uniontown | | OH |
| | | | Government & Public Services | | 2305 Hudson Boulevard | | Brownsville | | TX |
| | | | Government & Public Services | | 257 Bosley Industrial Park | | Parkersburg | | WV |
| | | | Government & Public Services | | 2805 Pine Mill Road | | Paris | | TX |
| | | | Government & Public Services | | 4521 Thomas Jefferson Street | | Caldwell | | ID |
| | | | Government & Public Services | | 3381 U.S. Highway 277 | | Eagle Pass | | TX |
| | | | Government & Public Services | | 2475 Cliff Creek Crossing Drive | | Dallas | | TX |
| | | | Government & Public Services | | 3644 Avtech Parkway | | Redding | | CA |
| | | | Government & Public Services | | 5100 W 36th Street | | Minneapolis | | MN |
| | | | Government & Public Services | | 4551 State Route 11 (E) | | Malone | | NY |
| | | | Government & Public Services | | 2600 Voyager Avenue | | Sioux City | | IA |
| | | | Government & Public Services | | 135 Circle Lane | | Knoxville | | TN |
| | | | Government & Public Services | | 9912 & 9934 Little Road | | New Port Richey | | FL |
| | | | Health Care Equipment & Services | | 2304 State Highway 121 | | Bedford | | TX |
| | | | Vacant | | 5411 E. Williams Boulevard | | Tucson | | AZ |
| | | | Government & Public Services | | 3369 U.S. Highway 277 | | Eagle Pass | | TX |
| | | | Transportation | | 942 S. Shady Grove Road | | Memphis | | TN |
| | | | Transportation | | 4151 Bridgeway Avenue | | Columbus | | OH |
| | | | Food & Staples Retailing | | 1411 Lake Cook Road | | Deerfield | | IL |
| | | | Food & Staples Retailing | | 1415 Lake Cook Road | | Deerfield | | IL |
| | | | Food & Staples Retailing | | 1417 Lake Cook Road | | Deerfield | | IL |
| | | | Food & Staples Retailing | | 1419 Lake Cook Road | | Deerfield | | IL |
| | | | Food & Staples Retailing | | 1425 Lake Cook Road | | Deerfield | | IL |
| | | | Food & Staples Retailing | | 1435 Lake Cook Road | | Deerfield | | IL |
| | | | Capital Goods | | 601 Third Street SE | | Cedar Rapids | | IA |
| | | | Consumer Durables & Apparel | | 15 LaSalle Square | | Providence | | RI |
| | | | Materials | | 100 Sci Park Boulevard | | East Windsor | | NJ |
| | | | Media & Entertainment | | 6005 Fair Lakes Road | | East Syracuse | | NY |
| | | | Government & Public Services | | 310 Canaveral Groves Boulevard | | Cocoa | | FL |
| | | | Vacant | | 8640 Evans Avenue | | Berkeley | | MO |
| | | | Government & Public Services | | 103 & 104 Airport Road | | Grangeville | | ID |
| | | | Government & Public Services | | 2901 Alta Mesa Boulevard | | Fort Worth | | TX |
| | | | Government & Public Services | | 59 Dunning Way | | Plattsburgh | | NY |
| | | | Financial Institutions | | 480 Jefferson Boulevard | | Warwick | | RI |
| | | | Energy | | 1800 Nelson Road | | Longmont | | CO |
| | | | Health Care Equipment & Services | | 1850 Norman Drive North | | Waukegan | | IL |
| | | | Health Care Equipment & Services | | 1333 - 1385 East Shaw Avenue | | Fresno | | CA |
| | | | Telecommunication Services | | 2270 Lakeside Boulevard | | Richardson | | TX |
| | | | Health Care Equipment & Services | | 5859 Farinon Drive | | San Antonio | | TX |
| | | | Energy | | 202 S. Cheyenne | | Tulsa | | OK |
See the Definitions section for a description of the Company's non-GAAP and operating metrics.
Orion Office REIT Inc. | WWW.ONLREIT.COM | 25
| | | | | | | | |
| | |
| Q4 2022 SUPPLEMENTAL INFORMATION |
| | | | | | | | | | | | | | | | | | | | | | | | |
| | | | Industry | | Address | | City | | State |
| | | | Vacant | | 7475 S. Joliet Street | | Englewood | | CO |
| | | | Consumer Durables & Apparel | | 4340 & 4350 South Monaco Street | | Denver | | CO |
| | | | Vacant | | 2250 Lakeside Boulevard | | Richardson | | TX |
| | | | Commercial & Professional Services | | 3833 Greenway Drive | | Lawrence | | KS |
| | | | Commercial & Professional Services | | 2201 Noria Road | | Lawrence | | KS |
| | | | Materials | | 1585 Sawdust Road | | The Woodlands | | TX |
| | | | Consumer Durables & Apparel | | 7390 S. Iola Street | | Englewood | | CO |
| | | | Vacant | | 41 Moores Road | | Malvern | | PA |
| | | | Media & Entertainment | | 1320 N. Dr. MLK Jr. Drive | | Milwaukee | | WI |
| | | | Telecommunication Services | | 695 Grassmere Park | | Nashville | | TN |
| | | | Commercial & Professional Services | | 1575 Sawdust Road | | The Woodlands | | TX |
| | | | Retailing | | 101 Riverview Parkway | | Santee | | CA |
| | | | Materials | | 6752 Baymeadow Drive | | Glen Burnie | | MD |
| | | | Health Care Equipment & Services | | 6655 North MacArthur Boulevard | | Irving | | TX |
| | | | Capital Goods | | 2087 East 71st Street | | Tulsa | | OK |
| | | | Government & Public Services | | 333 Scott Street | | Covington | | KY |
| | | | Software & Services | | 1759 Wehrle Dr | | Amherst | | NY |
| | | | Commercial & Professional Services | | 6377 Emerald Drive | | Dublin | | OH |
| | | | Capital Goods | | 22640 Davis Drive | | Sterling | | VA |
| | | | Capital Goods | | 1100 Atwater Drive, Lot 11A | | Malvern | | PA |
| | | | Health Care Equipment & Services | | 7353 Company Drive | | Indianapolis | | IN |
| | | | Health Care Equipment & Services | | 1640 Dallas Parkway | | Plano | | TX |
| | | | Capital Goods | | 1705 Kellie Drive | | Blair | | NE |
| | | | Commercial & Professional Services | | 955 American Lane Unit 1 | | Schaumburg | | IL |
| | | | Insurance | | 3100 Quail Springs Parkway | | Oklahoma City | | OK |
| | | | Software & Services | | 777 Research Road | | Lincoln | | NE |
| | | | Insurance | | 249-257 West Genesee Street | | Buffalo | | NY |
| | | | Insurance | | 3275 Bennett Creek Avenue | | Urbana | | MD |
| | | | Health Care Equipment & Services | | 100 Airpark Center Drive East | | Nashville | | TN |
| | | | Retailing | | 3074 Chastain Meadows Parkway NW | | Kennesaw | | GA |
| | | | Capital Goods | | 4205 River Green Parkway | | Duluth | | GA |
| | | | Pharmaceuticals, Biotechnology & Life Sciences | | 8 Sylvan way | | Parsippany | | NJ |
| | | | Software & Services | | 174 & 176 Middlesex Turnpike | | Bedford | | MA |
| | | | Financial Institutions | | 1500-1600 Merrill Lynch Drive | | Hopewell | | NJ |
| | | | Health Care Equipment & Services | | 3003 N. 3rd Street | | Phoenix | | AZ |
| | | | Capital Goods | | 70 Mechanic Street | | Foxboro | | MA |
| | | | Health Care Equipment & Services | | 577 Aptakisic Road | | Lincolnshire | | IL |
| | | | Transportation | | 360 Westar Boulevard | | Westerville | | OH |
| | | | Software & Services | | 12975 Worldgate Drive | | Herndon | | VA |
| | | | Transportation | | 580 Atlas Air Way | | Erlanger | | KY |
| | | | Utilities | | 700 Market Street | | St. Louis | | MO |
| | | | | | | | | | |
__________________________________
(1)Includes the properties owned by the Company's Unconsolidated Joint Venture.
See the Definitions section for a description of the Company's non-GAAP and operating metrics.
Orion Office REIT Inc. | WWW.ONLREIT.COM | 26
| | | | | | | | |
| | |
| Q4 2022 SUPPLEMENTAL INFORMATION |
| | |
|
Unconsolidated Joint Venture Investment Summary (unaudited, square feet and dollars in thousands) |
|
The following table summarizes the Company's investments in the Arch Street Unconsolidated Joint Venture as of December 31, 2022.
| | | | | | | | | | | | | | | | | | | | | | | | | | | | | | | | | | | | | | | | |
| | Legal Ownership Percentage (1) | | | Tenant Industry | | Pro Rata Share of Gross Real Estate Investments | | Pro Rata Share of Rentable Square Feet | | Pro Rata Share of Annualized Base Rent | | Pro Rata Share of Principal Outstanding | |
| Schneider Electric - Foxboro, MA | | 20% | | | Capital Goods | | $ | 8,336 | | | 50 | | | $ | 713 | | | $ | 5,090 | | |
| Sysmex - Lincolnshire, IL | | 20% | | | Health Care Equipment & Services | | 9,239 | | | 33 | | | 795 | | | 5,448 | | |
| DHL - Westerville, OH | | 20% | | | Transportation | | 6,676 | | | 29 | | | 430 | | | 3,972 | | |
| Peraton - Herndon, VA | | 20% | | | Software & Services | | 9,687 | | | 33 | | | 1,126 | | | 6,000 | | |
| Atlas Air - Erlanger, KY | | 20% | | | Transportation | | 5,330 | | | 20 | | | 317 | | | 3,162 | | |
| Spire Energy - St. Louis, MO | | 20% | | | Utilities | | 6,159 | | | 26 | | | 394 | | | 3,660 | | |
| | | | | | | $ | 45,427 | | | 191 | | | $ | 3,775 | | | $ | 27,332 | | |
__________________________________
(1)Legal ownership percentage may, at times, not equal the Company's economic interest because of various provisions in the joint venture agreement regarding capital contributions, distributions of cash flow based on capital account balances and allocations of profits and losses.
See the Definitions section for a description of the Company's non-GAAP and operating metrics.
Orion Office REIT Inc. | WWW.ONLREIT.COM | 27
| | | | | | | | |
| | |
Q4 2022 SUPPLEMENTAL INFORMATION |
| | |
|
Definitions (unaudited, in thousands, except share and per share data) |
|
Annualized Base Rent is the monthly aggregate cash amount charged to tenants under our leases (including monthly base rent receivables and certain contractually obligated reimbursements by our tenants), as of the final date of the applicable period, multiplied by 12, including the Company's pro rata share of such amounts related to the Unconsolidated Joint Venture. Annualized Base Rent is not indicative of future performance.
CPI refers to a lease in which base rent is adjusted based on changes in a consumer price index.
Credit Rating of a tenant refers to the Standard & Poor's or Moody's credit rating and such rating also may reflect the rating assigned by Standard & Poor's or Moody's to the lease guarantor or the parent company as applicable.
Double Net Lease ("NN") is a lease under which the tenant agrees to pay all operating expenses associated with the property (e.g., real estate taxes, insurance, maintenance), but excludes some or all major repairs (e.g., roof, structure, parking lot, in each case, as further defined in the applicable lease).
Earnings Before Interest, Taxes, Depreciation and Amortization for Real Estate ("EBITDAre") and Adjusted EBITDA
Due to certain unique operating characteristics of real estate companies, as discussed below, the National Association of Real Estate Investment Trusts, Inc. ("Nareit"), an industry trade group, has promulgated a supplemental performance measure known as Earnings Before Interest, Taxes, Depreciation and Amortization for Real Estate. Nareit defines EBITDAre as net income or loss computed in accordance with GAAP, adjusted for interest expense, income tax expense (benefit), depreciation and amortization, impairment write-downs on real estate, gains or losses from disposition of property and our pro rata share of EBITDAre adjustments related to the Unconsolidated Joint Venture. We calculated EBITDAre in accordance with Nareit's definition described above.
In addition to EBITDAre, we use Adjusted EBITDA as a non-GAAP supplemental performance measure to evaluate the operating performance of the Company. Adjusted EBITDA, as defined by the Company, represents EBITDAre, modified to exclude non-routine items such as transaction related expenses and spin related expenses. We also exclude certain non-cash items such as impairments of intangible and right of use assets, gains or losses on derivatives, gains or losses on the extinguishment or forgiveness of debt, amortization of intangibles, above-market lease assets and deferred lease incentives, net of amortization of below-market lease liabilities and our pro rata share of Adjusted EBITDA adjustments related to the Unconsolidated Joint Venture. Management believes that excluding these costs from EBITDAre provides investors with supplemental performance information that is consistent with the performance models and analysis used by management, and provides investors a view of the performance of our portfolio over time. Therefore, EBITDAre and Adjusted EBITDA should not be considered as an alternative to net income, as computed in accordance with GAAP. The Company uses Adjusted EBITDA as one measure of its operating performance when formulating corporate goals and evaluating the effectiveness of the Company's strategies. EBITDAre and Adjusted EBITDA may not be comparable to similarly titled measures of other companies.
Enterprise Value equals the sum of the Implied Equity Market Capitalization and Net Debt, in each case, as of an applicable date.
Fixed Charge Coverage Ratio is (a) Adjusted EBITDA divided by (b) the sum of (i) Interest Expense, excluding non-cash amortization and (ii) secured debt principal amortization on Adjusted Principal Outstanding. Management believes that Fixed Charge Coverage Ratio is a useful supplemental measure of our ability to satisfy fixed financing obligations.
Fixed Dollar or Percent Increase refers to a lease that requires contractual rent increases during the term of the lease agreement. A Fixed Dollar or Percent Increase lease may include a period of free rent at the beginning or end of the lease.
Flat refers to a lease that requires equal rent payments, with no contractual increases, throughout the term of the lease agreement. A Flat Lease may include a period of free rent at the beginning or end of the lease.
Orion Office REIT Inc. | WWW.ONLREIT.COM | 28
| | | | | | | | |
| | |
Q4 2022 SUPPLEMENTAL INFORMATION |
| | |
|
Definitions (cont.) (unaudited, in thousands, except share and per share data) |
|
Funds Available for Distribution ("FAD")
Funds available for distribution, as defined by the Company, represents Core FFO, as defined below, modified to exclude capital expenditures, as well as certain non-cash items such as amortization of deferred financing costs, amortization of above market leases and deferred lease incentives, net of amortization of below market lease liabilities, straight-line rental revenue, equity-based compensation, equity in income or losses of the Unconsolidated Joint Venture and our pro rata share of FAD adjustments related to the Unconsolidated Joint Venture. Management believes that adjusting these items from Core FFO provides investors with supplemental performance information that is consistent with the performance models and analysis used by management and provides useful information regarding the Company's ability to fund its dividend. Beginning in 2023, the Company's definition of FAD will not adjust for the following items, which will already be an adjustment in calculating Core FFO: (i) amortization of deferred lease incentives, (ii) amortization of deferred financing costs, (iii) equity-based compensation, and (iv) amortization of premiums and discounts on debt, net. Additionally, the Company will revise the FAD adjustment for equity in income (loss) of unconsolidated joint venture to only exclude the non-cash amortization related to the joint venture investment basis difference. If this definitional change had been made in 2022, the impact would have been an increase to FAD for the year-ended December 31, 2022 of $0.5 million, or $0.01 per share. This change in definition will be applied retrospectively beginning January 1, 2023.
However, not all REITs calculate FAD and those that do may not calculate FAD the same way, so comparisons with other REITs may not be meaningful. FAD should not be considered as an alternative to net income (loss) or cash flow provided by (used in) operating activities as determined under GAAP.
Nareit Funds from Operations ("Nareit FFO" or "FFO") and Core Funds from Operations ("Core FFO")
Due to certain unique operating characteristics of real estate companies, as discussed below, Nareit has promulgated a supplemental performance measure known as FFO, which we believe to be an appropriate supplemental performance measure to reflect the operating performance of a REIT. FFO is not equivalent to our net income or loss as determined under GAAP.
Nareit defines FFO as net income or loss computed in accordance with GAAP adjusted for gains or losses from disposition of real estate assets, depreciation and amortization of real estate assets, impairment write-downs on real estate, and our pro rata share of FFO adjustments related to the Unconsolidated Joint Venture. We calculate FFO in accordance with Nareit's definition described above.
In addition to FFO, we use Core FFO as a non-GAAP supplemental financial performance measure to evaluate the operating performance of the Company. Core FFO, as defined by the Company, excludes from FFO items that we believe do not reflect the ongoing operating performance of our business such as transaction related expenses, spin related expenses and gains or losses on extinguishment of swaps and/or debt, and our pro rata share of Core FFO adjustments related to the Unconsolidated Joint Venture. Beginning in 2023, the Company will be revising its definition of Core FFO to also exclude the following non-cash charges which management believes do not reflect the ongoing operating performance of our business: (i) amortization of deferred lease incentives, (ii) amortization of deferred financing costs, (iii) equity-based compensation, and (iv) amortization of premiums and discounts on debt, net. If this definitional change had been made in 2022, the impact would have been an increase to Core FFO for the year-ended December 31, 2022 of $6.4 million, or $0.11 per share. This change in definition will be applied retrospectively beginning January 1, 2023.
We believe that FFO and Core FFO allow for a comparison of the performance of our operations with other publicly-traded REITs, as FFO and Core FFO, or an equivalent measure, are routinely reported by publicly-traded REITs, each adjust for items that we believe do not reflect the ongoing operating performance of our business and we believe are often used by analysts and investors for comparison purposes.
Orion Office REIT Inc. | WWW.ONLREIT.COM | 29
| | | | | | | | |
| | |
Q4 2022 SUPPLEMENTAL INFORMATION |
| | |
|
Definitions (cont.) (unaudited, in thousands, except share and per share data) |
|
For all of these reasons, we believe FFO and Core FFO, in addition to net income (loss), as defined by GAAP, are helpful supplemental performance measures and useful in understanding the various ways in which our management evaluates the performance of the Company over time. However, not all REITs calculate FFO and Core FFO the same way, so comparisons with other REITs may not be meaningful. FFO and Core FFO should not be considered as alternatives to net income (loss) and are not intended to be used as a liquidity measure indicative of cash flow available to fund our cash needs. Neither the SEC, Nareit, nor any other regulatory body has evaluated the acceptability of the exclusions used to adjust FFO in order to calculate Core FFO and its use as a non-GAAP financial performance measure.
GAAP is an abbreviation for generally accepted accounting principles in the United States.
Gross Lease is a lease under which the landlord is responsible for all expenses associated with the property (e.g., real estate taxes, insurance, maintenance and repairs).
Gross Real Estate Investments represent total gross real estate and related assets of Operating Properties and the Company's pro rata share of such amounts related to properties owned by the Unconsolidated Joint Venture, net of gross intangible lease liabilities. Gross Real Estate Investments should not be considered as an alternative to the Company's real estate investments balance as determined in accordance with GAAP or any other GAAP financial measures and should only be considered together with, and as a supplement to, the Company's financial information prepared in accordance with GAAP.
The following table shows a reconciliation of Gross Real Estate Investments to the amounts presented in accordance with GAAP on the balance sheets for the periods presented (in thousands):
| | | | | | | | | | | | | | | | | | | | | | | | | | | | | | | | |
| | December 31, 2022 | | September 30, 2022 | | June 30, 2022 | | March 31, 2022 | | December 31, 2021 |
| Total real estate investments, at cost - as reported | | $ | 1,366,625 | | | $ | 1,380,903 | | | $ | 1,459,199 | | | $ | 1,486,255 | | | $ | 1,481,745 | |
| Adjustments: | | | | | | | | | | |
| Gross intangible lease assets | | 360,690 | | | 364,058 | | | 371,110 | | | 370,981 | | | 370,049 | |
| Gross intangible lease liabilities | | (31,317) | | | (31,317) | | | (35,068) | | | (35,068) | | | (35,068) | |
| Gross assets held for sale | | 2,544 | | | 7,530 | | | 9,402 | | | — | | | — | |
Proportionate share of Unconsolidated Joint Venture Gross Real Estate Investments | | 45,427 | | | 45,426 | | | 45,425 | | | 45,413 | | | 45,401 | |
| Gross Real Estate Investments | | $ | 1,743,969 | | | $ | 1,766,600 | | | $ | 1,850,068 | | | $ | 1,867,581 | | | $ | 1,862,127 | |
GSA CPI refers to a General Services Administration ("GSA") lease that includes a contractually obligated operating cost component of rent which is adjusted annually based on changes in a consumer price index.
Implied Equity Market Capitalization equals shares of common stock outstanding as of an applicable date, multiplied by the closing sale price of the Company's stock as reported on the New York Stock Exchange on such date.
Industry is derived from the Global Industry Classification Standard ("GICS") Methodology that was developed by Morgan Stanley Capital International ("MSCI") in collaboration with S&P Dow Jones Indices to establish a global, accurate, complete and widely accepted approach to defining industries and classifying securities by industry.
Interest Coverage Ratio equals Adjusted EBITDA divided by Interest Expense, excluding non-cash amortization. Management believes that Interest Coverage Ratio is a useful supplemental measure of our ability to service our debt obligations.
Interest Expense, excluding non-cash amortization is a non-GAAP measure that represents interest expense incurred on the outstanding principal balance of our debt and the Company's pro rata share of the Unconsolidated Joint Venture's interest expense incurred on its outstanding principal balance. This measure excludes the amortization of deferred financing costs, premiums and discounts, which is included in interest expense in accordance with GAAP. Interest Expense, excluding non-cash amortization should not be considered as an alternative to the Company's interest expense as determined in accordance with GAAP or any other GAAP financial measures and should only be considered together with and as a supplement to the Company's financial information prepared in accordance with GAAP.
Orion Office REIT Inc. | WWW.ONLREIT.COM | 30
| | | | | | | | |
| | |
Q4 2022 SUPPLEMENTAL INFORMATION |
| | |
|
Definitions (cont.) (unaudited, in thousands, except share and per share data) |
|
The following table shows a reconciliation of Interest Expense, excluding non-cash amortization to interest expense presented in accordance with GAAP on the statements of operations for the periods presented (in thousands):
| | | | | | | | | | | | | | | | | | | | | | | | | | | | | | | | |
| | Year Ended | | Three Months Ended |
| | December 31, 2022 | | December 31, 2022 | | September 30, 2022 | | June 30, 2022 | | March 31, 2022 |
| Interest expense, net - as reported | | $ | 30,171 | | | $ | 7,553 | | | $ | 7,904 | | | $ | 7,867 | | | $ | 6,847 | |
| Adjustments: | | | | | | | | | | |
| Amortization of deferred financing costs and other non-cash charges | | (4,363) | | | (1,068) | | | (1,067) | | | (1,057) | | | (1,171) | |
| | | | | | | | | | |
Proportionate share of Unconsolidated Joint Venture Interest Expense, excluding non-cash amortization | | 931 | | | 367 | | | 294 | | | 155 | | | 115 | |
| Interest Expense, excluding non-cash amortization | | $ | 26,739 | | | $ | 6,852 | | | $ | 7,131 | | | $ | 6,965 | | | $ | 5,791 | |
Investment-Grade Tenants are those with a Credit Rating of BBB- or higher from Standard & Poor's or a Credit Rating of Baa3 or higher from Moody's. The ratings may reflect those assigned by Standard & Poor’s or Moody’s to the lease guarantor or the parent company, as applicable.
Leased Square Feet is Rentable Square Feet leased and includes such amounts related to the Unconsolidated Joint Venture.
Modified Gross Lease is a lease under which the landlord is responsible for most expenses associated with the property (e.g., real estate taxes, insurance, maintenance and repairs), but passes through some operating expenses to the tenant.
Month-to-Month refers to a lease that is outside of the contractual lease expiration, but the tenant has not vacated and continues to pay rent which may also include holdover rent if applicable.
Net Debt, Principal Outstanding and Adjusted Principal Outstanding
Principal Outstanding is a non-GAAP measure that represents the Company's outstanding principal debt balance, excluding certain GAAP adjustments, such as premiums and discounts, financing and issuance costs, and related accumulated amortization. Adjusted Principal Outstanding includes the Company's pro rata share of the Unconsolidated Joint Venture's outstanding principal debt balance. We believe that the presentation of Principal Outstanding and Adjusted Principal Outstanding, which show our contractual debt obligations, provides useful information to investors to assess our overall financial flexibility, capital structure and leverage. Principal Outstanding and Adjusted Principal Outstanding should not be considered as alternatives to the Company's consolidated debt balance as determined in accordance with GAAP or any other GAAP financial measures and should only be considered together with, and as a supplement to, the Company's financial information prepared in accordance with GAAP.
Net Debt is a non-GAAP measure used to show the Company's Adjusted Principal Outstanding, less all cash and cash equivalents and the Company's pro rata share of the Unconsolidated Joint Venture's cash and cash equivalents. We believe that the presentation of Net Debt provides useful information to investors because our management reviews Net Debt as part of its management of our overall liquidity, financial flexibility, capital structure and leverage.
The following table shows a reconciliation of Net Debt, Principal Outstanding and Adjusted Principal Outstanding to the amounts presented in accordance with GAAP on the balance sheets for the periods presented (in thousands):
Orion Office REIT Inc. | WWW.ONLREIT.COM | 31
| | | | | | | | |
| | |
Q4 2022 SUPPLEMENTAL INFORMATION |
| | |
|
Definitions (cont.) (unaudited, in thousands, except share and per share data) |
|
| | | | | | | | | | | | | | | | | | | | | | | | | | | | | | | | |
| | December 31, 2022 | | September 30, 2022 | | June 30, 2022 | | March 31, 2022 | | December 31,
2021 |
| Bridge facility, net | | $ | — | | | $ | — | | | $ | — | | | $ | — | | | $ | 354,357 | |
| Mortgages payable, net | | 352,167 | | | 351,994 | | | 351,820 | | | 351,648 | | | — | |
| Credit facility term loan, net | | 173,815 | | | 173,478 | | | 173,133 | | | 172,793 | | | 172,490 | |
| Credit facility revolver | | — | | | 31,000 | | | 71,000 | | | 91,000 | | | 90,000 | |
| Total debt - as reported | | 525,982 | | | 556,472 | | | 595,953 | | | 615,441 | | | 616,847 | |
| Deferred financing costs, net | | 4,018 | | | 4,528 | | | 5,047 | | | 5,559 | | | 3,153 | |
| Principal Outstanding | | 530,000 | | | 561,000 | | | 601,000 | | | 621,000 | | | 620,000 | |
Proportionate share of Unconsolidated Joint Venture Principal Outstanding | | 27,332 | | | 27,332 | | | 27,332 | | | 27,332 | | | 27,332 | |
| Adjusted Principal Outstanding | | $ | 557,332 | | | $ | 588,332 | | | $ | 628,332 | | | $ | 648,332 | | | $ | 647,332 | |
| Cash and cash equivalents | | (20,638) | | | (23,282) | | | (19,300) | | | (18,585) | | | (29,318) | |
Proportionate share of Unconsolidated Joint Venture cash and cash equivalents | | (572) | | | (758) | | | (623) | | | (652) | | | (590) | |
| Net Debt | | $ | 536,122 | | | $ | 564,292 | | | $ | 608,409 | | | $ | 629,095 | | | $ | 617,424 | |
Net Debt Leverage Ratio equals Net Debt divided by Gross Real Estate Investments.
Net Operating Income ("NOI") and Cash NOI
NOI is a non-GAAP performance measure used to evaluate the operating performance of a real estate company. NOI represents total revenues less property operating expenses and excludes fee revenue earned for services to the Unconsolidated Joint Venture, impairment, depreciation and amortization, general and administrative expenses, transaction related expenses and spin related expenses. Cash NOI excludes the impact of certain GAAP adjustments included in rental revenue, such as straight-line rent adjustments and amortization of above-market intangible lease assets and below-market lease intangible liabilities. Cash NOI includes the pro rata share of such amounts from properties owned by the Unconsolidated Joint Venture. It is management's view that NOI and Cash NOI provide investors relevant and useful information because it reflects only income and operating expense items that are incurred at the property level and presents them on an unleveraged basis. NOI and Cash NOI should not be considered as an alternative to operating income in accordance with GAAP. Further, NOI and Cash NOI may not be comparable to similarly titled measures of other companies.
Orion Office REIT Inc. | WWW.ONLREIT.COM | 32
| | | | | | | | |
| | |
Q4 2022 SUPPLEMENTAL INFORMATION |
| | |
|
Definitions (cont.) (unaudited, in thousands, except share and per share data) |
|
The following table shows the calculation of NOI and Cash NOI for the periods presented (in thousands):
| | | | | | | | | | | | | | | | | | | | | | | | | | | | | | | | |
| | Year Ended | | Three Months Ended |
| | December 31, 2022 | | December 31, 2022 | | September 30, 2022 | | June 30, 2022 | | March 31, 2022 |
| Total revenues | | $ | 208,118 | | | $ | 50,294 | | | $ | 51,769 | | | $ | 52,849 | | | $ | 53,206 | |
| Less total operating expenses | | (276,792) | | | (63,142) | | | (97,663) | | | (60,382) | | | (55,605) | |
| Fee income from unconsolidated joint venture | | (765) | | | (197) | | | (189) | | | (190) | | | (189) | |
| Transaction related | | 675 | | | 277 | | | 194 | | | 141 | | | 63 | |
| Spin related | | 964 | | | — | | | — | | | 208 | | | 756 | |
| General and administrative | | 15,908 | | | 4,428 | | | 4,672 | | | 3,291 | | | 3,517 | |
| Depreciation and amortization | | 131,367 | | | 30,493 | | | 32,693 | | | 33,828 | | | 34,353 | |
| Impairment of real estate | | 66,359 | | | 12,198 | | | 44,801 | | | 7,758 | | | 1,602 | |
| NOI | | 145,834 | | | 34,351 | | | 36,277 | | | 37,503 | | | 37,703 | |
| Straight-line rent | | 769 | | | 2,911 | | | (699) | | | (547) | | | (896) | |
| Amortization of above and below market leases, net | | (1,207) | | | (260) | | | (312) | | | (315) | | | (320) | |
| Deferred lease incentives | | 116 | | | 80 | | | 36 | | | — | | | — | |
| Other non-cash adjustments | | 200 | | | 51 | | | 50 | | | 48 | | | 51 | |
Proportionate share of Unconsolidated Joint Venture Cash NOI | | 3,380 | | | 833 | | | 848 | | | 850 | | | 849 | |
| Cash NOI | | $ | 149,092 | | | $ | 37,966 | | | $ | 36,200 | | | $ | 37,539 | | | $ | 37,387 | |
Occupancy Rate equals the sum of Leased Square Feet divided by Rentable Square Feet and includes the Company's pro rata share of such amounts related to the Unconsolidated Joint Venture, in each case, as of an applicable date.
Operating Properties refers to all properties owned and consolidated by the Company as of the applicable date.
Property Operating Expense includes reimbursable and non-reimbursable costs to operate a property, including real estate taxes, utilities, insurance, repairs, maintenance, legal, property management fees, etc.
Rentable Square Feet is leasable square feet of Operating Properties and the Company's pro rata share of leasable square feet of properties owned by the Unconsolidated Joint Venture.
Triple Net Lease ("NNN") is a lease under which the tenant agrees to pay all expenses associated with the property (e.g., real estate taxes, insurance, maintenance and repairs in accordance with the lease terms).
Unconsolidated Joint Venture means the Company's investment in the unconsolidated joint venture with an affiliate of Arch Street Capital Partners, LLC.
Unencumbered Asset Ratio equals Unencumbered Gross Real Estate Investments divided by Gross Real Estate Investments. Management believes that Unencumbered Asset Ratio is a useful supplemental measure of our overall liquidity and leverage.
Unencumbered Gross Real Estate Investments equals Gross Real Estate Investments, excluding Gross Real Estate Investments related to properties serving as collateral for the Company's CMBS Loan and the Company's pro rata share of properties owned by the Unconsolidated Joint Venture that are pledged as collateral under mortgage debt. Unencumbered Gross Real Estate Investments includes otherwise unencumbered properties which are part of the unencumbered property pool under our credit facility and therefore generally are not available to serve as collateral under other borrowings.
Weighted Average Remaining Lease Term is the number of years remaining on each respective lease as of the applicable date, weighted based on Annualized Base Rent and includes the years remaining on each of the respective leases of the Unconsolidated Joint Venture, weighted based on the Company's pro rata share of Annualized Base Rent related to the Unconsolidated Joint Venture.
Orion Office REIT Inc. | WWW.ONLREIT.COM | 33