Exhibit 99.2

Plano, Texas

Supplemental
Information Package
2026 Third Quarter
Orion Properties Inc. | WWW.ONLREIT.COM | 2
Q3 2026 SUPPLEMENTAL INFORMATION |
Orion Supplemental Information | |
September 30, 2026 |
Section | Page |
About the Data | |
Forward-Looking Statements | |
Company Overview | |
Balance Sheets | |
Statements of Operations | |
Funds From Operations (FFO), Core FFO and Funds Available for Distribution (FAD) | |
EBITDA, EBITDAre and Adjusted EBITDA | |
Capital Structure | |
Debt Detail | |
Ratio Analysis | |
Credit Facility Revolver Covenants | |
Net Operating Income (NOI) and Cash NOI | |
Leasing Activity | |
Vacant Property Operating Expenses | |
Acquisitions and Dispositions | |
Diversification Statistics: Operating Property Portfolio | |
Tenants Comprising Over 1% of Annualized Base Rent | |
Tenant Industry Diversification | |
Lease Expirations | |
Lease Summary | |
Operating Property Geographic Diversification | |
Operating Property Type | |
Operating Property Portfolio | |
Unconsolidated Joint Venture Investment Summary | |
Definitions |
Orion Properties Inc. | WWW.ONLREIT.COM | 3
Q3 2026 SUPPLEMENTAL INFORMATION |
About the Data |
This data and other information described herein are as of and for the quarter ended September 30, 2026, unless otherwise
indicated. Future performance may not be consistent with past performance and is subject to change and inherent risks and
uncertainties. This information should be read in conjunction with the consolidated financial statements and the
Management's Discussion and Analysis of Financial Condition and Results of Operations sections contained in Orion
Properties Inc.'s (the "Company," "Orion," "us," "our" and "we") Quarterly Reports on Form 10-Q for the periods ended
September 30, 2026, June 30, 2026 and March 31, 2026 and Annual Report on Form 10-K for the year ended
December 31, 2025.
Unconsolidated Joint Venture
The Company accounts for its investment in the Unconsolidated Joint Venture under the equity method of accounting and
during the year ended December 31, 2025, its share of cumulative losses, including impairment losses, exceeded the
carrying amount of its investment. Accordingly, the Company has suspended recognition of its share of additional losses
from the Unconsolidated Joint Venture and no contingent liabilities have been recorded related to the Unconsolidated Joint
Venture as of and for the three and nine months ended September 30, 2026. Additionally, since January 1, 2026, the
Company has been recording management fees from the Unconsolidated Joint Venture and interest income on its member
loan to the Unconsolidated Joint Venture (the "Member Loan") on a cash basis rather than an accrual basis. The Company
recognized $0.2 million and $0.5 million of management fees from the Unconsolidated Joint Venture during the three and
nine months ended September 30, 2026, respectively, and $0.2 million of interest on the Member Loan during the nine
months ended September 30, 2026. No interest on the Member Loan was recognized during the three months ended
September 30, 2026. The Company recognized $0.2 million and $0.6 million of management fees from the Unconsolidated
Joint Venture during the three and nine months ended September 30, 2025, respectively, and $0.3 million and $0.8 million of
interest on the Member Loan during the three and nine months ended September 30, 2025, respectively.
Orion Properties Inc. | WWW.ONLREIT.COM | 4
Q3 2026 SUPPLEMENTAL INFORMATION |
Forward-Looking Statements |
Information set forth herein includes "forward-looking statements" which reflect the Company's expectations and projections
regarding future events and plans, future financial condition, results of operations, liquidity and business, including leasing
and occupancy, acquisitions, dispositions, rent receipts, expected borrowings and financing costs and the payment of future
dividends. Generally, the words "anticipates," "assumes," "believes," "continues," "could," "estimates," "expects," "goals,"
"intends," "may," "plans," "projects," "seeks," "should," "targets," "will," "guidance," variations of such words and similar
expressions identify forward-looking statements. These forward-looking statements are based on information currently
available to the Company and involve a number of known and unknown assumptions and risks, uncertainties and other
factors, which may be difficult to predict and beyond the Company's control, that could cause actual events and plans or
could cause the Company's business, financial condition, liquidity and results of operations to differ materially from those
expressed or implied in the forward-looking statements. These factors include, among other things, those discussed below.
Information regarding historical rent collections should not serve as an indicator of future rent collections. We disclaim any
obligation to publicly update or revise any forward-looking statements, whether as a result of changes in underlying
assumptions or factors, new information, future events or otherwise, except as may be required by law.
The following are some, but not all, of the assumptions, risks, uncertainties and other factors that could cause the
Company's actual results to differ materially from those presented in the forward-looking statements:
•the risk of increases in interest rates, including that the value of our assets may decline, our borrowing costs have
increased and may continue to do so and we may be unable to extend or refinance our debt obligations on
favorable terms and in a timely manner, or at all;
•the risk of inflation, including that our operating costs, such as insurance premiums, utilities, real estate taxes,
capital expenditures and repair and maintenance costs, may rise;
•conditions associated with the global market, including an oversupply of office space, tenant credit risk and general
economic conditions and geopolitical conditions;
•our strategic review process is and will continue to be costly and time-consuming and may not result in a
transaction, and any transaction that occurs may not increase stockholder value;
•the risk that our strategic review process may disrupt our operations, divert management's attention and create
uncertainty for tenants, employees and counterparties;
•the risk that disruption in macroeconomic and general economic conditions could adversely impact our lenders,
tenants and prospective tenants, and cause them to reduce or decline to do business with us or fail to meet their
obligations to us;
•the extent to which changes in workplace practices and office space utilization, including remote and hybrid work
arrangements, and changes in government budgetary priorities, will continue and the impact that may have on
demand for office space at our properties;
•our ability to acquire new properties, convert certain vacant properties to multi-tenant use and sell non-core assets
on favorable terms and in a timely manner, or at all;
•risks associated with acquisitions, including the risk that we may not be in a position, or have the opportunity in the
future, to make suitable property acquisitions on advantageous terms and/or that such acquisitions will fail to
perform as expected;
•our assumptions concerning tenant utilization and renewal probability of Dedicated Use Assets, and our ability to
successfully execute on our strategy to shift our portfolio concentration over time away from traditional office
properties, towards more Dedicated Use Assets;
•our ability to comply with the terms of our credit agreements or to meet the debt obligations on our properties;
•our ability to access the capital markets to raise additional equity or refinance maturing debt on favorable terms and
in a timely manner, or at all;
•changes in the real estate industry and in performance of the financial markets and interest rates and our ability to
effectively hedge against interest rate changes;
•the risk of tenants defaulting on their lease obligations, which is heightened due to our focus on single-tenant
properties;
•our ability to renew leases with existing tenants or re-let vacant space to new tenants on favorable terms and in a
timely manner, or at all;
Orion Properties Inc. | WWW.ONLREIT.COM | 5
Q3 2026 SUPPLEMENTAL INFORMATION |
•the cost of rent concessions, tenant improvement allowances and leasing commissions;
•the potential for termination of existing leases pursuant to tenant termination rights;
•the amount, growth and relative inelasticity of our expenses;
•risks associated with the ownership and development of real property;
•risks accompanying our investment in and the management of OAP/VER Venture, LLC (the "Unconsolidated Joint
Venture"), our unconsolidated joint venture, in which we hold a non-controlling ownership interest, including that the
Unconsolidated Joint Venture may be unable to repay all or any portion of its mortgage debt obligations which
experienced a payment default at maturity during February 2026, or complete the disposition or refinancing of any
of the six joint venture properties on favorable terms or in a timely manner, or at all, or that the lenders may seek to
enforce their foreclosure or other remedies due to the debt being beyond its initially stated maturity, and we may be
unable to recover our original investment in the Unconsolidated Joint Venture, which we have written down to zero
or, in the case of the Member Loan, fully reserved accordingly;
•our ability to close pending real estate transactions, which may be subject to conditions that are outside of our
control;
•we may change our dividend policy at any time, and therefore the amount, timing and continued payment of
dividends are not assured;
•our properties may be subject to impairment charges;
•risks resulting from losses in excess of insured limits or uninsured losses;
•risks associated with the potential volatility of our common stock; and
•the risk that we may fail to maintain our income tax qualification as a real estate investment trust.
Additional factors that may affect future results are contained in the Company's filings with the SEC, which are available on
the SEC’s website at www.sec.gov. The Company disclaims any obligation to publicly update or revise any forward-looking
statements, whether as a result of changes in underlying assumptions or factors, new information, future events or
otherwise, except as required by law.
See the Definitions section for a description of the Company's non-GAAP and operating metrics.
Orion Properties Inc. | WWW.ONLREIT.COM | 6
Q3 2026 SUPPLEMENTAL INFORMATION |
Company Overview (unaudited) |
Orion is a real estate company incorporated in the state of Maryland on July 1, 2021, which has elected to be taxed as a
real estate investment trust ("REIT") for U.S. federal income tax purposes, commencing with its initial taxable year ended
December 31, 2021.
Orion is an internally managed REIT engaged in the ownership, acquisition and management of a diversified portfolio of
office properties in high-quality suburban markets across the United States and leased primarily on a single-tenant net lease
basis to creditworthy tenants. The Company's portfolio is comprised of traditional office properties, as well as governmental,
medical office, flex/laboratory and R&D and flex/industrial properties. As part of its investment strategy, the Company
intends to shift its portfolio concentration over time away from traditional office properties, towards more Dedicated Use
Assets.
As of September 30, 2026, Orion owned and operated a portfolio of 57 Operating Properties with an aggregate of 6.4 million
leasable square feet located in 26 states. As of September 30, 2026, Orion's Annualized Base Rent was $107.0 million, with
67.8% of Annualized Base Rent derived from Investment-Grade Tenants and 40.6% derived from properties deemed to be
Dedicated Use Assets, or DUAs. The Company's Occupancy Rate was 78.3% and the Weighted Average Remaining Lease
Term was 6.1 years.
The top tenants, tenant industries and geographic locations of the Company's Operating Properties are outlined in the
following sections: "Tenants Comprising Over 1% of Annualized Base Rent," "Tenant Industry Diversification," and
"Operating Property Geographic Diversification," respectively.
Tenants, Trademarks and Logos
Orion is not affiliated or associated with, is not endorsed by, does not endorse, and is not sponsored by or a sponsor of the
tenants or of their products or services pictured or mentioned. The names, logos and all related product and service names,
design marks and slogans are the trademarks or service marks of their respective companies.
Orion Properties Inc. | WWW.ONLREIT.COM | 7
Q3 2026 SUPPLEMENTAL INFORMATION |
Company Overview (continued) |
Senior Management | Board of Directors | |
Paul H. McDowell, Chief Executive Officer, President | Reginald H. Gilyard, Non-Executive Chairman, Independent Director | |
Gavin B. Brandon, Executive Vice President, Chief Financial Officer and Treasurer | Kathleen R. Allen, Ph.D., Independent Director | |
Christopher H. Day, Executive Vice President, Chief Operating Officer | Richard J. Lieb, Independent Director | |
Paul C. Hughes, General Counsel and Secretary | Gregory J. Whyte, Independent Director | |
Revea L. Schmidt, Senior Vice President, Chief Accounting Officer | Paul H. McDowell, Chief Executive Officer, President and Director |
Corporate Offices and Contact Information
3200 E Camelback Road, Suite 100 | 122 E. 42nd Street, Suite 5100 | |
Phoenix, AZ 85018 | New York, NY 10168 | |
602-698-1002 | ||
www.ONLREIT.com |
Trading Symbol: ONL
Stock Exchange Listing: New York Stock Exchange
Transfer Agent
Computershare Trust Company, N.A. |
c/o Computershare Investor Services |
P.O. Box 43006 |
Providence, RI 02940-3006 |
Toll Free: 877-218-2434 |
International: 781-575-3017 |
Orion Properties Inc. | WWW.ONLREIT.COM | 8
Q3 2026 SUPPLEMENTAL INFORMATION |
Balance Sheets (unaudited, in thousands) |
September 30, 2026 | June 30, 2026 | March 31, 2026 | December 31, 2025 | September 30, 2025 | ||||||
Assets | ||||||||||
Real estate investments, at cost: | ||||||||||
Land | $167,254 | $167,254 | $178,765 | $176,532 | $187,415 | |||||
Buildings, fixtures and improvements | 962,663 | 956,882 | 983,994 | 976,676 | 986,834 | |||||
Total real estate investments, at cost | 1,129,917 | 1,124,136 | 1,162,759 | 1,153,208 | 1,174,249 | |||||
Less: accumulated depreciation | 204,111 | 196,198 | 197,281 | 195,042 | 188,317 | |||||
Total real estate investments, net | 925,806 | 927,938 | 965,478 | 958,166 | 985,932 | |||||
Accounts receivable, net | 44,553 | 41,111 | 47,644 | 35,333 | 32,611 | |||||
Intangible lease assets, net | 74,054 | 77,872 | 81,691 | 75,947 | 80,102 | |||||
Cash and cash equivalents | 13,731 | 16,870 | 10,274 | 22,362 | 32,639 | |||||
Restricted cash | 50,450 | 46,659 | 50,259 | 38,277 | 30,126 | |||||
Real estate assets held for sale, net | — | — | — | 12,803 | 14,969 | |||||
Other assets, net | 27,956 | 29,625 | 32,945 | 27,614 | 46,414 | |||||
Total assets | $1,136,550 | $1,140,075 | $1,188,291 | $1,170,502 | $1,222,793 | |||||
Liabilities and Equity | ||||||||||
Mortgages payable, net | $331,955 | $331,802 | $366,927 | $371,957 | $371,772 | |||||
Credit facility revolver | 102,000 | 102,000 | 127,000 | 92,000 | 110,000 | |||||
Accounts payable and accrued expenses | 26,860 | 25,471 | 35,318 | 40,219 | 40,300 | |||||
Below-market lease liabilities, net | 16,964 | 17,429 | 17,939 | 18,449 | 18,959 | |||||
Distributions payable | 1,141 | 1,141 | 1,137 | 1,208 | 1,126 | |||||
Other liabilities, net | 27,254 | 28,203 | 30,180 | 22,154 | 20,519 | |||||
Total liabilities | 506,174 | 506,046 | 578,501 | 545,987 | 562,676 | |||||
Common stock | 57 | 57 | 57 | 56 | 56 | |||||
Additional paid-in capital | 1,153,510 | 1,152,706 | 1,151,892 | 1,151,644 | 1,150,246 | |||||
Accumulated other comprehensive loss | — | — | — | (5) | (17) | |||||
Accumulated deficit | (524,436) | (520,011) | (543,432) | (528,482) | (491,463) | |||||
Total stockholders' equity | 629,131 | 632,752 | 608,517 | 623,213 | 658,822 | |||||
Non-controlling interest | 1,245 | 1,277 | 1,273 | 1,302 | 1,295 | |||||
Total equity | 630,376 | 634,029 | 609,790 | 624,515 | 660,117 | |||||
Total liabilities and equity | $1,136,550 | $1,140,075 | $1,188,291 | $1,170,502 | $1,222,793 |
Orion Properties Inc. | WWW.ONLREIT.COM | 9
Q3 2026 SUPPLEMENTAL INFORMATION |
Statements of Operations (unaudited, in thousands, except per share data) |
Three Months Ended | ||||||||||
September 30, 2026 | June 30, 2026 | March 31, 2026 | December 31, 2025 | September 30, 2025 | ||||||
Revenues: | ||||||||||
Rental | $35,235 | $34,098 | $36,134 | $35,010 | $36,918 | |||||
Fee income from Unconsolidated Joint Venture | 198 | 206 | 137 | 209 | 204 | |||||
Total revenues | 35,433 | 34,304 | 36,271 | 35,219 | 37,122 | |||||
Operating expenses: | ||||||||||
Property operating | 14,282 | 12,477 | 14,783 | 15,199 | 17,284 | |||||
General and administrative | 4,735 | 4,611 | 5,140 | 5,972 | 4,607 | |||||
Depreciation and amortization | 12,518 | 13,520 | 13,159 | 13,087 | 14,709 | |||||
Impairments | — | — | 6,296 | 14,466 | 63,698 | |||||
Transaction related | 120 | 312 | 259 | 645 | 114 | |||||
Total operating expenses | 31,655 | 30,920 | 39,637 | 49,369 | 100,412 | |||||
Other (expenses) income: | ||||||||||
Interest expense, net | (7,099) | (7,330) | (7,250) | (7,473) | (7,880) | |||||
Gain on disposition of real estate assets | — | 28,826 | — | 2,902 | 3,265 | |||||
Loss on extinguishment of debt, net | — | (288) | (244) | — | — | |||||
Other income | 117 | 63 | 243 | 312 | 317 | |||||
Other expenses | — | (1) | (3,319) | (360) | (1,116) | |||||
Recovery of (reserve on) Member Loan | — | — | 439 | (5,926) | — | |||||
Equity in loss and impairment of investment in Unconsolidated Joint Venture, net | — | — | — | (11,049) | (256) | |||||
Total other (expenses) income, net | (6,982) | 21,270 | (10,131) | (21,594) | (5,670) | |||||
(Loss) income before taxes | (3,204) | 24,654 | (13,497) | (35,744) | (68,960) | |||||
Provision for income taxes | (69) | (71) | (71) | (59) | (67) | |||||
Net (loss) income | (3,273) | 24,583 | (13,568) | (35,803) | (69,027) | |||||
Net income attributable to non-controlling interest | (11) | (4) | (10) | (7) | (8) | |||||
Net (loss) income attributable to common stockholders | $(3,284) | $24,579 | $(13,578) | $(35,810) | $(69,035) | |||||
Weighted average common shares outstanding - basic | 57,045 | 56,946 | 56,565 | 56,316 | 56,313 | |||||
Weighted average common shares outstanding - diluted | 57,045 | 58,106 | 56,565 | 56,316 | 56,313 | |||||
Net (loss) income per share attributable to common stockholders - basic | $(0.06) | $0.43 | $(0.24) | $(0.64) | $(1.23) | |||||
Net (loss) income per share attributable to common stockholders - diluted | $(0.06) | $0.42 | $(0.24) | $(0.64) | $(1.23) | |||||
See the Definitions section for a description of the Company's non-GAAP and operating metrics.
Orion Properties Inc. | WWW.ONLREIT.COM | 10
Q3 2026 SUPPLEMENTAL INFORMATION |
Funds From Operations (FFO), Core FFO and Funds Available for Distribution (FAD) (unaudited, in thousands, except per share data) |
Three Months Ended | ||||||||||
September 30, 2026 | June 30, 2026 | March 31, 2026 | December 31, 2025 | September 30, 2025 | ||||||
Net (loss) income attributable to common stockholders | $(3,284) | $24,579 | $(13,578) | $(35,810) | $(69,035) | |||||
Adjustments: | ||||||||||
Depreciation and amortization of real estate assets | 12,480 | 13,481 | 13,125 | 13,050 | 14,681 | |||||
Gain on disposition of real estate assets | — | (28,826) | — | (2,902) | (3,265) | |||||
Impairment of real estate | — | — | 6,296 | 14,466 | 63,698 | |||||
Impairment of investment in Unconsolidated Joint Venture and proportionate share of adjustments for items above, as applicable | — | — | — | 11,280 | 474 | |||||
FFO attributable to common stockholders | $9,196 | $9,234 | $5,843 | $84 | $6,553 | |||||
Transaction related | 120 | 312 | 259 | 645 | 114 | |||||
Amortization of deferred financing costs | 1,081 | 928 | 845 | 932 | 933 | |||||
Amortization of deferred lease incentives, net | 207 | 221 | 162 | 136 | 175 | |||||
Equity-based compensation, net | 804 | 814 | 770 | 1,242 | 852 | |||||
Loss on extinguishment of debt, net | — | 288 | 244 | — | — | |||||
Other adjustments, net | 41 | 1 | 3,618 | 7,508 | 2,366 | |||||
Proportionate share of Unconsolidated Joint Venture adjustments for items above, as applicable | — | — | — | 11 | 14 | |||||
Core FFO attributable to common stockholders | $11,449 | $11,798 | $11,741 | $10,558 | $11,007 | |||||
Amortization of above and below market leases, net | (279) | (312) | (312) | (312) | (312) | |||||
Straight-line rental revenue | (3,109) | (2,998) | 1,830 | (2,077) | (4,898) | |||||
Unconsolidated Joint Venture basis difference amortization | — | — | — | 114 | 114 | |||||
Capital expenditures and leasing costs | (6,943) | (8,852) | (18,651) | (17,777) | (18,283) | |||||
Other adjustments, net | 164 | 222 | 123 | 75 | 66 | |||||
Proportionate share of Unconsolidated Joint Venture adjustments for the items above, as applicable | — | — | — | 33 | 27 | |||||
FAD attributable to common stockholders | $1,282 | $(142) | $(5,269) | $(9,386) | $(12,279) | |||||
Weighted average common shares outstanding - basic | 57,045 | 56,946 | 56,565 | 56,316 | 56,313 | |||||
Effect of weighted average dilutive securities (1) | 986 | 1,160 | 698 | 705 | 530 | |||||
Weighted average common shares outstanding - diluted | 58,031 | 58,106 | 57,263 | 57,021 | 56,843 | |||||
FFO attributable to common stockholders per diluted share | $0.16 | $0.16 | $0.10 | $0.00 | $0.12 | |||||
Core FFO attributable to common stockholders per diluted share | $0.20 | $0.20 | $0.21 | $0.19 | $0.19 | |||||
FAD attributable to common stockholders per diluted share | $0.02 | $0.00 | $(0.09) | $(0.17) | $(0.22) | |||||
___________________________________
(1)Dilutive securities include unvested restricted stock units net of assumed repurchases in accordance with the treasury stock method and exclude
performance-based restricted stock units for which the thresholds have not been met by the end of the applicable reporting period. Such dilutive
securities are not included when calculating net loss per diluted share applicable to the Company for the periods presented above, as the effect would
be antidilutive.
See the Definitions section for a description of the Company's non-GAAP and operating metrics.
Orion Properties Inc. | WWW.ONLREIT.COM | 11
Q3 2026 SUPPLEMENTAL INFORMATION |
EBITDA, EBITDAre and Adjusted EBITDA (unaudited, in thousands) |
Three Months Ended | ||||||||||
September 30, 2026 | June 30, 2026 | March 31, 2026 | December 31, 2025 | September 30, 2025 | ||||||
Net (loss) income attributable to common stockholders | $(3,284) | $24,579 | $(13,578) | $(35,810) | $(69,035) | |||||
Adjustments: | ||||||||||
Interest expense, net | 7,099 | 7,330 | 7,250 | 7,473 | 7,880 | |||||
Depreciation and amortization | 12,518 | 13,520 | 13,159 | 13,087 | 14,709 | |||||
Provision for income taxes | 69 | 71 | 71 | 59 | 67 | |||||
Proportionate share of Unconsolidated Joint Venture adjustments for items above, as applicable | — | — | — | 972 | 1,004 | |||||
EBITDA | $16,402 | $45,500 | $6,902 | $(14,219) | $(45,375) | |||||
Gain on disposition of real estate assets | — | (28,826) | — | (2,902) | (3,265) | |||||
Impairment of real estate | — | — | 6,296 | 14,466 | 63,698 | |||||
Impairment of investment in Unconsolidated Joint Venture and proportionate share of adjustments for items above, as applicable | — | — | — | 10,805 | — | |||||
EBITDAre | $16,402 | $16,674 | $13,198 | $8,150 | $15,058 | |||||
Transaction related | 120 | 312 | 259 | 645 | 114 | |||||
Amortization of above and below market leases, net | (279) | (312) | (312) | (312) | (312) | |||||
Amortization of deferred lease incentives, net | 207 | 221 | 162 | 136 | 175 | |||||
Loss on extinguishment of debt, net | — | 288 | 244 | — | — | |||||
Other adjustments, net | 41 | 1 | 3,618 | 7,508 | 2,366 | |||||
Proportionate share of Unconsolidated Joint Venture adjustments for items above, as applicable | — | — | — | (8) | (7) | |||||
Adjusted EBITDA | $16,491 | $17,184 | $17,169 | $16,119 | $17,394 | |||||
See the Definitions section for a description of the Company's non-GAAP and operating metrics.
Orion Properties Inc. | WWW.ONLREIT.COM | 12
Q3 2026 SUPPLEMENTAL INFORMATION |
Capital Structure (unaudited, dollars and shares in thousands, except per share amounts) |
Capitalization Table | |||||
September 30, 2026 | |||||
Common stock outstanding | 57,045 | ||||
Stock price | $2.49 | ||||
Implied Equity Market Capitalization | $142,042 | ||||
Wtd. Avg. Maturity (Years) | Wtd. Avg. Interest Rate (1) | Principal Outstanding | |||
Mortgages payable (2) | 2.5 | 5.02% | $334,494 | ||
Credit facility revolver (3) | 1.4 | 6.62% | 102,000 | ||
Total secured debt | 2.3 | 5.39% | $436,494 | ||
Total unsecured debt | — | —% | — | ||
Total Principal Outstanding | 2.3 | 5.39% | $436,494 | ||
Total Capitalization | $578,536 | ||||
Cash and cash equivalents | 13,731 | ||||
Restricted cash | 50,450 | ||||
Enterprise Value | $514,355 | ||||
Net Debt/Enterprise Value | 72.4% | ||||
Net Debt/Gross Real Estate Investments | 27.8% | ||||
Fixed Charge Coverage Ratio | 2.74x | ||||
Liquidity (4) | $177,181 | ||||
Net Debt/Annualized Most Recent Quarter Adjusted EBITDA | 5.64x | ||||
Net Debt/Annualized Year-to-Date Adjusted EBITDA | 5.49x | ||||
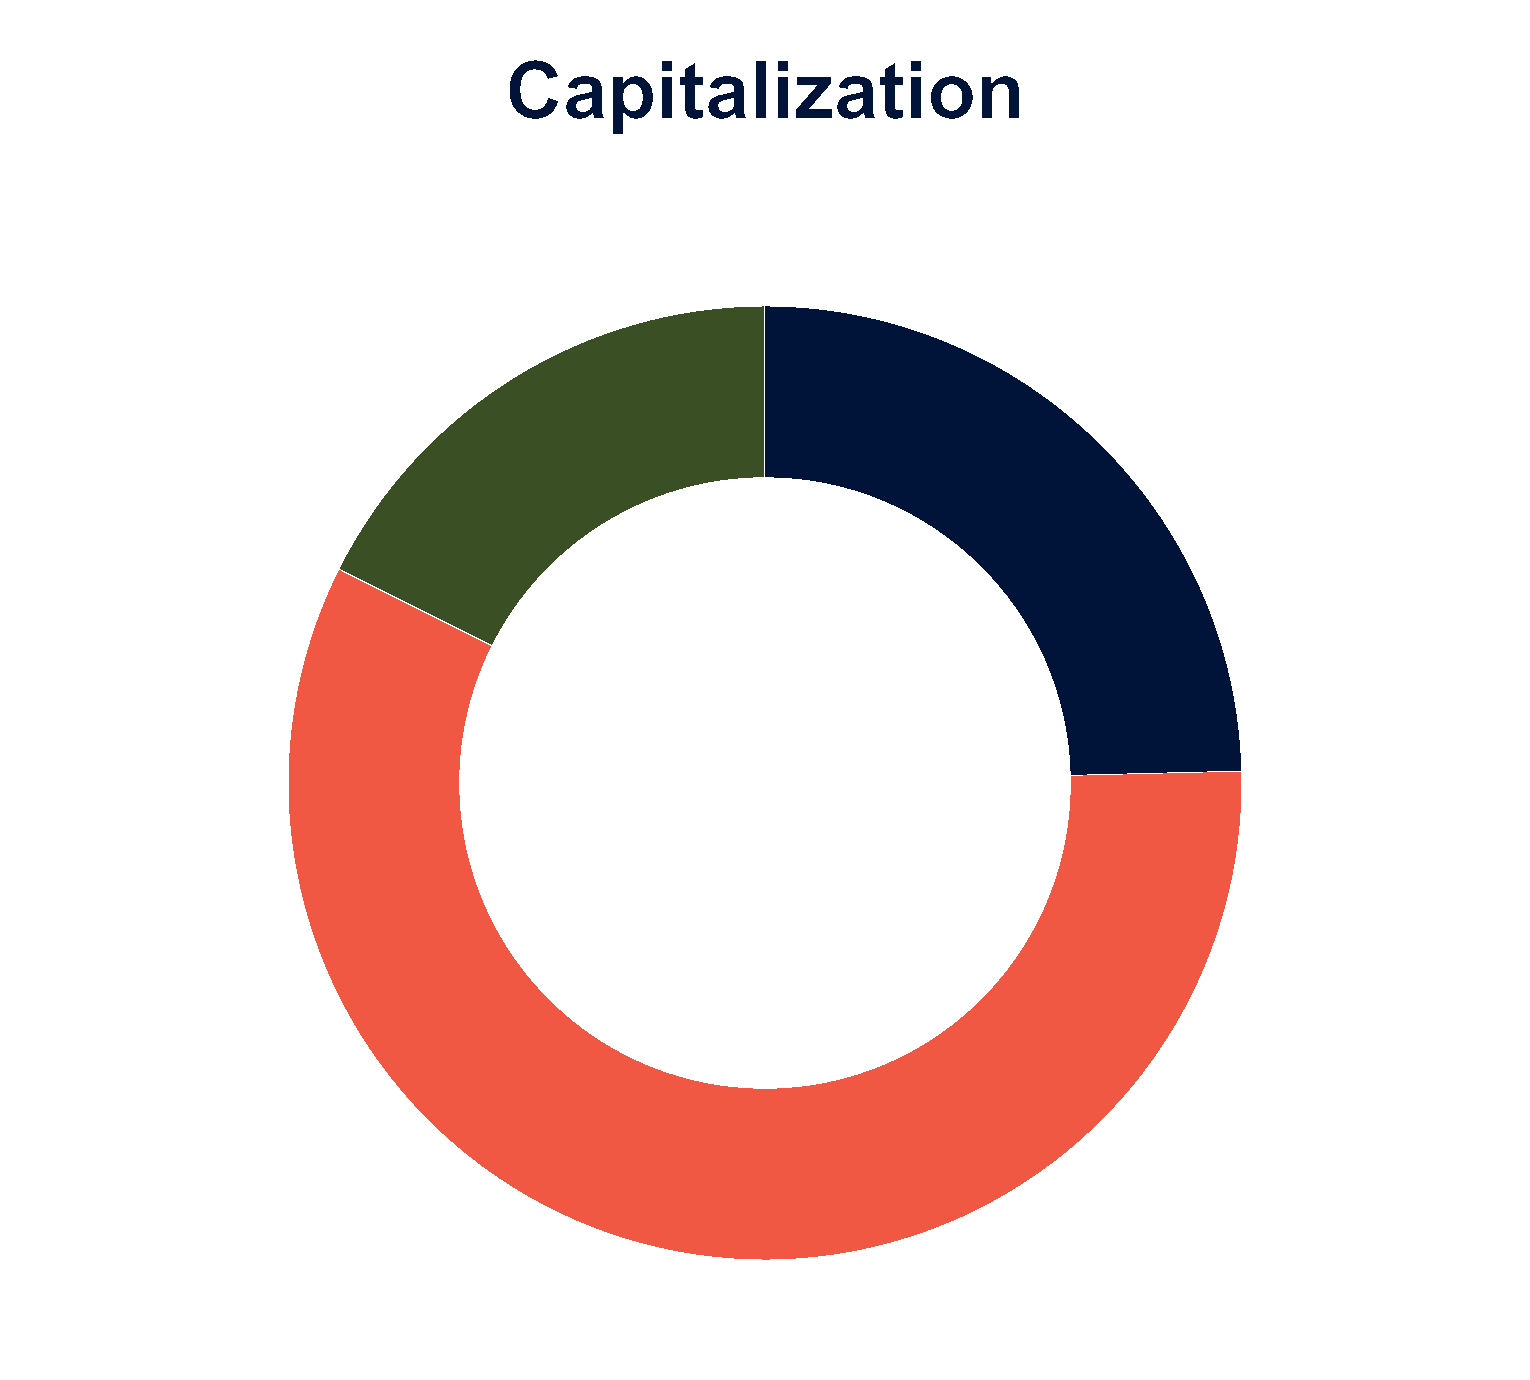
Common equity | 24.6% | ||
Mortgages payable (2) | 57.8% | ||
Credit facility revolver (3) | 17.6% |
___________________________________
(1)Interest rate for variable rate debt represents the interest rate in effect as of September 30, 2026.
(2)Includes $316.5 million securitized mortgage loan secured by 18 of the Company's properties (the "CMBS Loan") which bears interest at a fixed rate
of 4.971%. The CMBS Loan is scheduled to mature on February 11, 2029, subject to two borrower extension options for a total of 18 months if certain
conditions have been satisfied. Pursuant to the loan modification agreement with the lender in February 2026, the lender will sweep all excess monthly
cash flows from the properties collateralizing the CMBS Loan, after payment of interest and property operating expenses, until maturity to a
combination of prepaying the outstanding principal balance of the CMBS Loan and funding an all-purpose reserve. The Company made principal
payments of $38.5 million on the CMBS Loan during the nine months ended September 30, 2026. Also includes $18.0 million fixed rate mortgage loan
secured by the San Ramon, California property (the "San Ramon Loan") which bears interest at a fixed rate of 5.90% and matures on December 1,
2031.
(3)The credit facility revolver maturity date is February 18, 2028, subject to two six-month borrower extension options until February 18, 2029 if we satisfy
certain conditions. The Company's maximum borrowing capacity under the credit facility revolver is $215.0 million and amounts borrowed by the
Company may be prepaid and re-borrowed from time to time. The Company's outstanding borrowings under the credit facility revolver bear interest at
a floating rate of, at the election of the Company, Daily Simple SOFR, Term SOFR or a base rate, plus an applicable margin of 2.75% for SOFR loans
and 1.75% for base rate loans. During August 2026, the Company entered into an interest rate cap agreement for the credit facility revolver. Under the
agreement, the Daily Simple SOFR is capped at 4.25% on a total notional amount of $50.0 million effective from August 7, 2026 to August 7, 2027.
The credit facility revolver is a senior secured fully recourse borrowing facility.
(4)Liquidity represents cash and cash equivalents and restricted cash of $64.2 million as well as $113.0 million available capacity on the Company's
credit facility revolver as of September 30, 2026.
See the Definitions section for a description of the Company's non-GAAP and operating metrics.
Orion Properties Inc. | WWW.ONLREIT.COM | 13
Q3 2026 SUPPLEMENTAL INFORMATION |
Debt Detail (unaudited, dollars in thousands) |
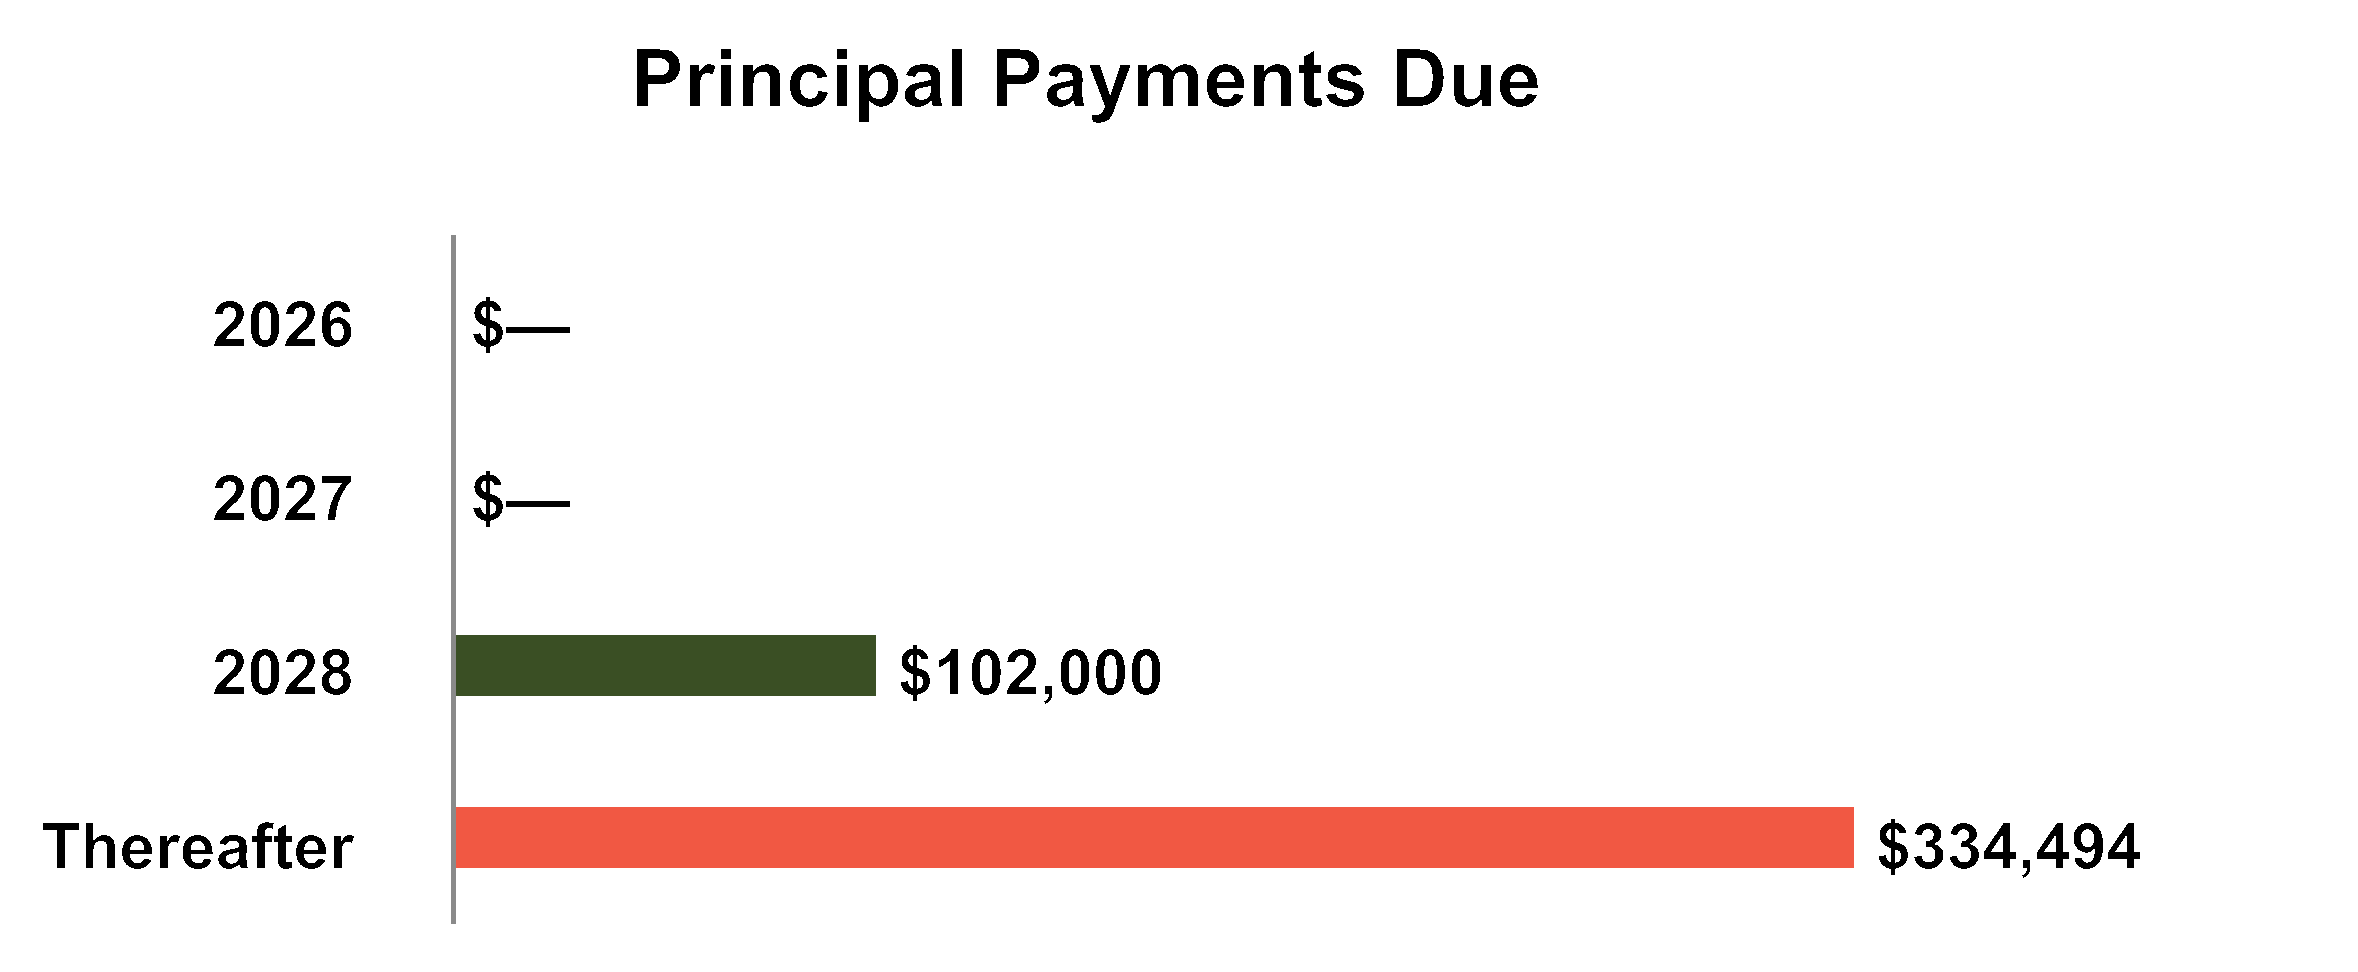
Principal Payments Due | Total | 2026 | 2027 | 2028 | Thereafter | |||||
Credit facility revolver (1) | $102,000 | $— | $— | $102,000 | $— | |||||
Mortgages payable (2) | 334,494 | — | — | — | 334,494 | |||||
Total Principal Outstanding | $436,494 | $— | $— | $102,000 | $334,494 |
Debt Type | Percentage of Principal Outstanding | Weighted Average Interest Rate (3) | Weighted Average Years to Maturity | |||
Credit facility revolver (1) | 23.4% | 6.62% | 1.4 | |||
Mortgages payable (2) | 76.6% | 5.02% | 2.5 | |||
Total | 100.0% | 5.39% | 2.3 | |||
Total unsecured debt | —% | —% | — | |||
Total secured debt | 100.0% | 5.39% | 2.3 | |||
Total | 100.0% | 5.39% | 2.3 | |||
Total fixed-rate debt | 76.6% | 5.02% | 2.5 | |||
Total variable-rate debt | 23.4% | 6.62% | 1.4 | |||
Total | 100.0% | 5.39% | 2.3 |
___________________________________
(1)See note 3 under the section "Capital Structure" for more information regarding the Company's credit facility revolver.
(2)See note 2 under the section "Capital Structure" for more information regarding the Company's mortgages payable.
(3)Interest rate for variable rate debt represents the interest rate in effect as of September 30, 2026.
See the Definitions section for a description of the Company's non-GAAP and operating metrics.
Orion Properties Inc. | WWW.ONLREIT.COM | 14
Q3 2026 SUPPLEMENTAL INFORMATION |
Ratio Analysis (unaudited, dollars in thousands) |
Three Months Ended | ||||||||||
September 30, 2026 | June 30, 2026 | March 31, 2026 | December 31, 2025 | September 30, 2025 | ||||||
Interest Coverage Ratio | ||||||||||
Interest Expense, excluding non-cash amortization (1) | $6,018 | $6,402 | $6,405 | $7,028 | $7,463 | |||||
Adjusted EBITDA (2) | 16,491 | 17,184 | 17,169 | 16,119 | 17,394 | |||||
Interest Coverage Ratio | 2.74x | 2.68x | 2.68x | 2.29x | 2.33x | |||||
Fixed Charge Coverage Ratio | ||||||||||
Interest Expense, excluding non-cash amortization (1) | $6,018 | $6,402 | $6,405 | $7,028 | $7,463 | |||||
Proportionate share of Unconsolidated Joint Venture adjustments for secured debt principal amortization | — | — | — | 144 | 146 | |||||
Total fixed charges | 6,018 | 6,402 | 6,405 | 7,172 | 7,609 | |||||
Adjusted EBITDA (2) | 16,491 | 17,184 | 17,169 | 16,119 | 17,394 | |||||
Fixed Charge Coverage Ratio | 2.74x | 2.68x | 2.68x | 2.25x | 2.29x | |||||
___________________________________
(1)Refer to the Statements of Operations section for interest expense calculated in accordance with GAAP and to the Definitions section for the required
reconciliation to the most directly comparable GAAP financial measure.
(2)Refer to the Statements of Operations section for net income (loss) calculated in accordance with GAAP and to the EBITDA, EBITDAre and Adjusted
EBITDA section for the required reconciliation to the most directly comparable GAAP financial measure.
September 30, 2026 | June 30, 2026 | March 31, 2026 | December 31, 2025 | September 30, 2025 | ||||||
Net Debt Ratios | ||||||||||
Net Debt (1) | $372,313 | $373,069 | $436,745 | $428,039 | $444,168 | |||||
Annualized Most Recent Quarter Adjusted EBITDA | 65,964 | 68,736 | 68,676 | 64,476 | 69,576 | |||||
Net Debt to Annualized Most Recent Quarter Adjusted EBITDA Ratio | 5.64x | 5.43x | 6.36x | 6.64x | 6.38x | |||||
Net Debt (1) | $372,313 | $373,069 | $436,745 | $428,039 | $444,168 | |||||
Annualized Year-to-Date Adjusted EBITDA (2) | 67,792 | 68,706 | 68,676 | 68,957 | 70,451 | |||||
Net Debt to Annualized Year-to-Date Adjusted EBITDA Ratio (2) | 5.49x | 5.43x | 6.36x | 6.21x | 6.30x | |||||
Net Debt (1) | $372,313 | $373,069 | $436,745 | $428,039 | $444,168 | |||||
Gross Real Estate Investments (1) | 1,340,130 | 1,334,983 | 1,374,543 | 1,382,757 | 1,423,695 | |||||
Net Debt Leverage Ratio | 27.8% | 27.9% | 31.8% | 31.0% | 31.2% |
___________________________________
(1)Refer to the Balance Sheets section for total debt and real estate investments, at cost calculated in accordance with GAAP and to the Definitions
section for the required reconciliation to the most directly comparable GAAP financial measure.
(2)Year-to-date Adjusted EBITDA for December 31, 2025 has not been annualized for the purpose of this calculation.
See the Definitions section for a description of the Company's non-GAAP and operating metrics.
Orion Properties Inc. | WWW.ONLREIT.COM | 15
Q3 2026 SUPPLEMENTAL INFORMATION |
Credit Facility Revolver Covenants (unaudited) |
The table that follows summarizes the financial covenants for the Company's credit facility revolver as defined and
calculated per the terms of the facility's credit agreement. These calculations are presented to investors to show the
Company's compliance with the financial covenants and are not measures of our liquidity or performance. As of
September 30, 2026, the Company was in compliance with these covenants based on the covenant limits and calculations
in place at that time.
Credit Facility Revolver Financial Covenants | Required | September 30, 2026 | ||
Ratio of total indebtedness to total asset value | ≤ 60% | 45.5% | ||
Ratio of adjusted EBITDA to fixed charges | ≥ 1.5x | 2.58x | ||
Consolidated tangible net worth | ≥ $740.6 million | $993.5 million | ||
Collateral property availability | ≥ $215.0 million | $301.8 million | ||
Collateral property debt yield | ≥ 13% | 32.3% |
See the Definitions section for a description of the Company's non-GAAP and operating metrics.
Orion Properties Inc. | WWW.ONLREIT.COM | 16
Q3 2026 SUPPLEMENTAL INFORMATION |
Net Operating Income (NOI) and Cash NOI (unaudited, dollars in thousands) |
Three Months Ended | ||||||||||
September 30, 2026 | June 30, 2026 | March 31, 2026 | December 31, 2025 | September 30, 2025 | ||||||
Rental revenue: | ||||||||||
Cash rental revenue | $21,932 | $22,534 | $26,511 | $20,372 | $21,469 | |||||
Fixed reimbursements | 1,790 | 1,711 | 1,659 | 1,546 | 1,526 | |||||
Variable reimbursements | 7,759 | 6,021 | 7,208 | 7,385 | 7,889 | |||||
Straight-line rental revenue | 3,109 | 2,998 | (1,830) | 2,077 | 4,898 | |||||
Amortization of above and below market leases, net | 279 | 312 | 312 | 312 | 312 | |||||
Amortization of deferred lease incentives, net | (207) | (221) | (162) | (136) | (175) | |||||
Other rental revenue | 573 | 743 | 2,436 | 3,454 | 999 | |||||
Total rental revenue | 35,235 | 34,098 | 36,134 | 35,010 | 36,918 | |||||
Property operating expense | (14,282) | (12,477) | (14,783) | (15,199) | (17,284) | |||||
NOI | $20,953 | $21,621 | $21,351 | $19,811 | $19,634 | |||||
Adjustments: | ||||||||||
Straight-line rental revenue | (3,109) | (2,998) | 1,830 | (2,077) | (4,898) | |||||
Amortization of above and below market leases, net | (279) | (312) | (312) | (312) | (312) | |||||
Amortization of deferred lease incentives, net | 207 | 221 | 162 | 136 | 175 | |||||
Other non-cash adjustments | 33 | 47 | 48 | 48 | 48 | |||||
Proportionate share of Unconsolidated Joint Venture Cash NOI | — | — | — | 893 | 900 | |||||
Cash NOI | $17,805 | $18,579 | $23,079 | $18,499 | $15,547 | |||||
See the Definitions section for a description of the Company's non-GAAP and operating metrics.
Orion Properties Inc. | WWW.ONLREIT.COM | 17
Q3 2026 SUPPLEMENTAL INFORMATION |
Leasing Activity (unaudited, square feet and dollars in thousands) |
During the periods indicated below, the Company entered into new and renewal leases as summarized in the following
tables:
Three Months Ended September 30, 2026 | ||||||
New Leases | Renewals | Total | ||||
Number of leases | 3 | 2 | 5 | |||
Rentable square feet leased | 48 | 95 | 143 | |||
Weighted average lease term (by rentable square feet) (years) - firm term (1) | 10.4 | 3.0 | 5.5 | |||
Weighted average lease term (by rentable square feet) (years) - non-firm term (1) | 10.4 | 3.0 | 5.5 | |||
Weighted average new term rental rate per rentable square foot per year (cash basis) | $23.41 | $25.91 | $25.07 | |||
Weighted average rental rate change (cash basis) (2) (3) | N/A | 25.2% | 25.2% | |||
Tenant rent concessions and leasing costs per rentable square foot per year - firm term (4) (5) | $9.26 | $0.68 | $6.17 | |||
Tenant rent concessions and leasing costs per rentable square foot per year - non-firm term (4) | $9.26 | $0.68 | $6.17 | |||
Three Months Ended September 30, 2025 | ||||||
New Leases | Renewals | Total | ||||
Number of leases | 2 | 5 | 7 | |||
Rentable square feet leased | 83 | 220 | 303 | |||
Weighted average lease term (by rentable square feet) (years) - firm term (1) | 5.8 | 11.6 | 10.0 | |||
Weighted average lease term (by rentable square feet) (years) - non-firm term (1) | 5.8 | 12.0 | 10.3 | |||
Weighted average new term rental rate per rentable square foot per year (cash basis) | $17.71 | $16.98 | $17.18 | |||
Weighted average rental rate change (cash basis) (2) (3) | 9.4% | 2.2% | 4.1% | |||
Tenant rent concessions and leasing costs per rentable square foot per year - firm term (4) (5) | $4.64 | $5.74 | $5.57 | |||
Tenant rent concessions and leasing costs per rentable square foot per year - non-firm term (4) | $4.64 | $5.54 | $5.40 | |||
____________________________________
(1)Firm term includes the non-cancelable portion of the lease term and any cancelable portion of the lease term if the tenant's right to cancel requires
payment of a termination fee. Non-firm term includes the firm term plus the portion of the lease term, principally under our United States Government
leases, where the tenant has the right to terminate without payment of a termination fee.
(2)Represents weighted average percentage increase or decrease in (i) the annualized monthly cash amount charged to the applicable tenants
(including monthly base rent receivables and certain fixed contractually obligated reimbursements by the applicable tenants, which may include
estimates) as of the commencement date of the new lease term (excluding any full or partial rent abatement period) compared to (ii) the annualized
monthly cash amount charged to the applicable tenants (including the monthly base rent receivables and certain fixed contractually obligated
reimbursements by the applicable tenants, which may include estimates) as of the expiration date of the prior lease term. Contractually obligated
reimbursements include estimated amortization of certain landlord funded improvements under our United States Government leases. If a space has
been or will be vacant for more than 12 months prior to the commencement of a new lease, was previously otherwise not generating full cash rental
revenue or if the lease types are not comparable, the lease will be excluded from the rental rate change calculation.
(3)Excludes three new leases for approximately 48,000 square feet for the three months ended September 30, 2026 that had been or will be vacant for
more than 12 months at the time the new lease commences. Excludes one new lease for approximately 3,000 square feet during the three months
ended September 30, 2025.
(4)Includes tenant improvement allowances and base building allowances, certain reimbursable and non-reimbursable landlord funded improvements,
leasing commissions and rent concessions (includes estimates of property operating expenses, where applicable). For its multi-tenant properties, the
Company has allocated the estimated cost of landlord funded improvements that benefit the property generally and/or the common areas and not the
tenant's premises in particular, to the applicable lease based on square footage of the related tenant.
(5)There were no reimbursable landlord funded improvements or tenant improvement allowances included in the tenant rent concessions and leasing
costs for the three months ended September 30, 2026 and 2025.
See the Definitions section for a description of the Company's non-GAAP and operating metrics.
Orion Properties Inc. | WWW.ONLREIT.COM | 18
Q3 2026 SUPPLEMENTAL INFORMATION |
Leasing Activity (continued) (unaudited, square feet and dollars in thousands) |
During the periods indicated below, the Company entered into new and renewal leases as summarized in the following
tables:
Nine Months Ended September 30, 2026 | ||||||
New Leases | Renewals | Total | ||||
Number of leases | 7 | 7 | 14 | |||
Rentable square feet leased | 249 | 451 | 700 | |||
Weighted average lease term (by rentable square feet) (years) - firm term (1) | 11.4 | 3.9 | 6.6 | |||
Weighted average lease term (by rentable square feet) (years) - non-firm term (1) | 11.4 | 3.9 | 6.6 | |||
Weighted average new term rental rate per rentable square foot per year (cash basis) | $17.52 | $29.65 | $25.34 | |||
Weighted average rental rate change (cash basis) (2) (3) | N/A | 1.8% | 1.8% | |||
Tenant rent concessions and leasing costs per rentable square foot per year - firm term (4) (5) | $6.25 | $4.05 | $5.40 | |||
Tenant rent concessions and leasing costs per rentable square foot per year - non-firm term (4) | $6.25 | $4.05 | $5.40 | |||
Nine Months Ended September 30, 2025 | ||||||
New Leases | Renewals (6) | Total | ||||
Number of leases | 5 | 10 | 15 | |||
Rentable square feet leased | 312 | 550 | 862 | |||
Weighted average lease term (by rentable square feet) (years) - firm term (1) | 9.5 | 6.7 | 7.7 | |||
Weighted average lease term (by rentable square feet) (years) - non-firm term (1) | 9.5 | 6.9 | 7.8 | |||
Weighted average new term rental rate per rentable square foot per year (cash basis) | $26.17 | $19.09 | $21.67 | |||
Weighted average rental rate change (cash basis) (2) (3) | 9.4% | (9.0)% | (7.1)% | |||
Tenant rent concessions and leasing costs per rentable square foot per year - firm term (4) (5) | $8.03 | $5.28 | $6.51 | |||
Tenant rent concessions and leasing costs per rentable square foot per year - non-firm term (4) | $8.03 | $5.15 | $6.42 | |||
____________________________________
(1)Firm term includes the non-cancelable portion of the lease term and any cancelable portion of the lease term if the tenant's right to cancel requires
payment of a termination fee. Non-firm term includes the firm term plus the portion of the lease term, principally under our United States Government
leases, where the tenant has the right to terminate without payment of a termination fee.
(2)Represents weighted average percentage increase or decrease in (i) the annualized monthly cash amount charged to the applicable tenants
(including monthly base rent receivables and certain fixed contractually obligated reimbursements by the applicable tenants, which may include
estimates) as of the commencement date of the new lease term (excluding any full or partial rent abatement period) compared to (ii) the annualized
monthly cash amount charged to the applicable tenants (including the monthly base rent receivables and certain fixed contractually obligated
reimbursements by the applicable tenants, which may include estimates) as of the expiration date of the prior lease term. Contractually obligated
reimbursements include estimated amortization of certain landlord funded improvements under our United States Government leases. If a space has
been or will be vacant for more than 12 months prior to the commencement of a new lease, was previously otherwise not generating full cash rental
revenue or if the lease types are not comparable, the lease will be excluded from the rental rate change calculation.
(3)Excludes seven new leases for approximately 249,000 square feet for the nine months ended September 30, 2026 that had been or will be vacant for
more than 12 months at the time the new lease commences. Excludes four new leases for approximately 232,000 square feet during the nine months
ended September 30, 2025.
(4)Includes tenant improvement allowances and base building allowances, certain reimbursable and non-reimbursable landlord funded improvements,
leasing commissions and rent concessions (includes estimates of property operating expenses, where applicable). For its multi-tenant properties, the
Company has allocated the estimated cost of landlord funded improvements that benefit the property generally and/or the common areas and not the
tenant's premises in particular, to the applicable lease based on square footage of the related tenant.
(5)There were no reimbursable landlord funded improvements or tenant improvement allowances included in the tenant rent concessions and leasing
costs for the nine months ended September 30, 2026. Tenant rent concessions and leasing costs per rentable square foot for the nine months ended
September 30, 2025 and attributable to new leases have been retrospectively updated to reduce the amount of tenant improvement allowances by
$0.53 per rentable square foot per year pursuant to the terms of a subsequent lease amendment entered into during the three months ended March
31, 2026.
(6)Includes the Company's proportionate share of rentable square feet and tenant rent concessions and leasing costs for one 163,000 square foot
renewal at a property owned by the Company's Unconsolidated Joint Venture.
See the Definitions section for a description of the Company's non-GAAP and operating metrics.
Orion Properties Inc. | WWW.ONLREIT.COM | 19
Q3 2026 SUPPLEMENTAL INFORMATION |
Vacant Property Operating Expenses (unaudited, square feet and dollars in thousands for the nine months ended September 30, 2026) |
Square Feet | Total Expenses | |||
Operating Properties | ||||
Fully vacant - full period (1) | 241 | $1,414 | ||
Fully vacant - partial period | 451 | 1,032 | ||
Substantially vacant - full period (2) | 291 | 1,426 | ||
Substantially vacant - partial period (2) | — | — | ||
Fully and substantially vacant subtotal | 983 | $3,872 | ||
Partially vacant (3) | 570 | 2,822 | ||
Total | 1,553 | $6,694 | ||
Disposed Properties | ||||
Fully vacant - full period | N/A | 1,885 | ||
Grand Total | $8,579 |
___________________________________
(1)The Company had five fully vacant Operating Properties as of September 30, 2026. All expenses are a component of property operating expenses in
the consolidated statements of operations and represent expenses for which the Company does not expect to be reimbursed.
(2)Operating Properties with an Occupancy Rate of 15% or lower are considered substantially vacant. The Company had one substantially vacant
Operating Property as of September 30, 2026.
(3)The Company does not record property operating expenses at the suite level; therefore, the total expenses for the nine months ended September 30,
2026 for partially vacant Operating Properties are estimated by multiplying the vacant square feet of the partially vacant Operating Properties by the
total annualized expenses per square foot for fully and substantially vacant Operating Properties and prorating for the nine months ended September
30, 2026.
See the Definitions section for a description of the Company's non-GAAP and operating metrics.
Orion Properties Inc. | WWW.ONLREIT.COM | 20
Q3 2026 SUPPLEMENTAL INFORMATION |
Acquisitions and Dispositions (unaudited, square feet and dollars in thousands) |
Acquisitions
The following table summarizes the Company's acquisition activity during the nine months ended September 30, 2026.
Date Purchased | Property Location | Square Feet | Gross Purchase Price | Adjusted Purchase Price (1) | Lease Term (Years) (2) | Cash Capitalization Rate | Average Capitalization Rate | |||||||
February 27, 2026 | Northbrook, IL | 75 | $15,000 | $14,064 | 10.8 | 8.1% | 9.0% | |||||||
June 30, 2026 | Lincoln, NE (3) | N/A | 575 | 575 | N/A | N/A | N/A | |||||||
Total | 75 | $15,575 | $14,639 |
___________________________________
(1)Represents Gross Purchase Price less, where applicable, adjustments to and credits against the purchase price agreed to by the Company pursuant
to the purchase and sale agreement. Adjusted Purchase Price is not net of transaction costs.
(2)Represents the remaining lease term as of the acquisition date.
(3)The Company acquired the fee simple interest in one parcel of land at a property located in Lincoln, Nebraska. The Company's ownership interest of
this property was previously comprised of a long-term ground lease interest. As of September 30, 2026, this property is approximately 96.7% leased to
two tenants with a weighted average remaining lease term of 4.9 years.
Dispositions
The following table summarizes the Company's disposition activity during the nine months ended September 30, 2026.
Date Sold | Property Location | Square Feet | Gross Sales Price | Adjusted Sales Price (1) | Lease Term (Years) | Cash Capitalization Rate | Average Capitalization Rate | |||||||
January 9, 2026 | Bedford, MA | 328 | $5,600 | $5,600 | Vacant | N/A | N/A | |||||||
January 15, 2026 | Malvern, PA | 188 | 7,500 | 7,500 | Vacant | N/A | N/A | |||||||
April 21, 2026 | Deerfield, IL (2) | N/A | 13,100 | 13,100 | Vacant | N/A | N/A | |||||||
May 1, 2026 | Glen Burnie, MD | 120 | 22,500 | 22,490 | Vacant | N/A | N/A | |||||||
June 5, 2026 | Columbus, OH | 140 | 35,000 | 35,000 | 5.8 | 5.6% | 5.7% | |||||||
Total | 776 | $83,700 | $83,690 |
___________________________________
(1)Represents Gross Sales Price less, where applicable, adjustments to and credits against the sales price agreed to by the Company pursuant to the
purchase and sale agreement. Adjusted Sales Price is not net of transaction costs.
(2)Includes six properties. No building square footage is associated with these properties due to the demolition of the buildings on the campus.
See the Definitions section for a description of the Company's non-GAAP and operating metrics.
Orion Properties Inc. | WWW.ONLREIT.COM | 21
Q3 2026 SUPPLEMENTAL INFORMATION |
Diversification Statistics: Operating Property Portfolio (unaudited, percentages based on portfolio Annualized Base Rent as of September 30, 2026, other than Occupancy Rate and Leased Rate which are based on Rentable Square Feet as of September 30, 2026) |
___________________________________________________
Statistics (square feet and dollars in thousands) | ||
Operating Properties | 57 | |
Non-Operating Properties | — | |
Rentable Square Feet | 6,352 | |
Annualized Base Rent | $107,017 | |
Occupancy Rate | 78.3% | |
Leased Rate | 78.3% | |
Weighted Average Remaining Lease Term | 6.1 | |
Investment-Grade Tenants | 67.8% | |
NN leases | 57.6% | |
NNN leases | 7.0% | |
See the Definitions section for a description of the Company's non-GAAP and operating metrics.
Orion Properties Inc. | WWW.ONLREIT.COM | 22
Q3 2026 SUPPLEMENTAL INFORMATION |
Tenants Comprising Over 1% of Annualized Base Rent (unaudited, square feet and dollars in thousands as of September 30, 2026) |
Tenant | Number of Leases | Occupied Square Feet | % of Total Rentable Square Feet | Annualized Base Rent | % of Total Annualized Base Rent | Credit Rating | ||||||
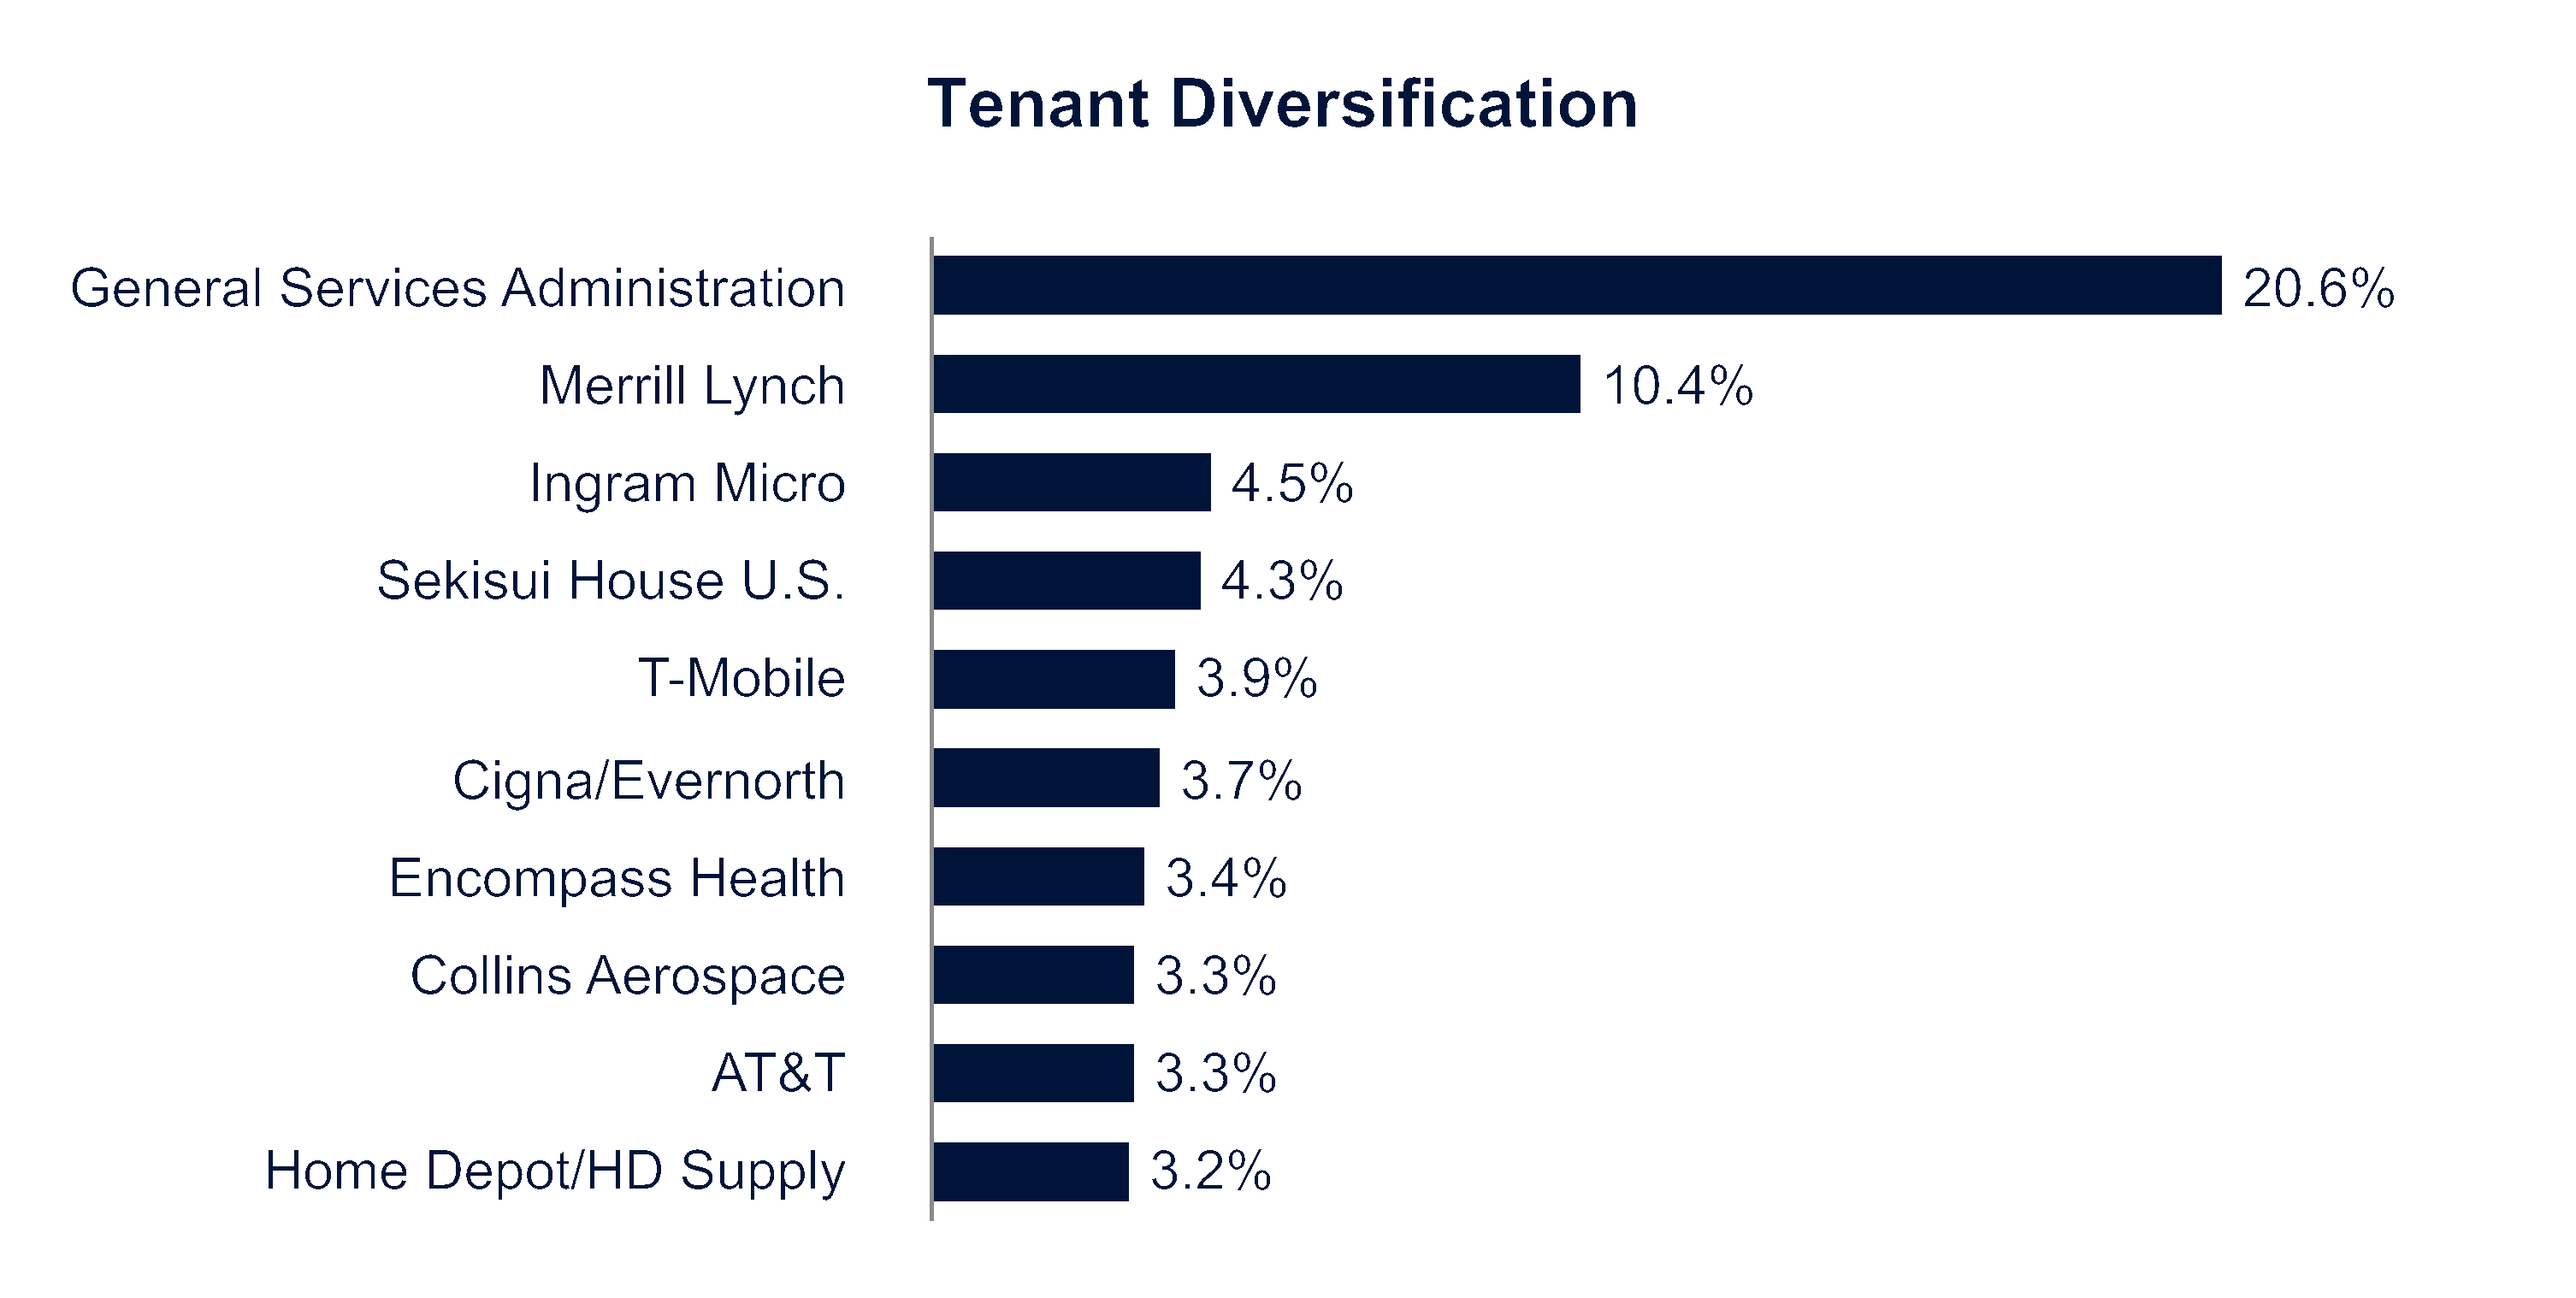
General Services Administration | 16 | 810 | 12.8% | $22,013 | 20.6% | AA+ | ||||||
Merrill Lynch | 1 | 482 | 7.6% | 11,136 | 10.4% | A- | ||||||
Ingram Micro | 1 | 161 | 2.5% | 4,795 | 4.5% | BB | ||||||
Sekisui House U.S. | 1 | 145 | 2.3% | 4,562 | 4.3% | BBB | ||||||
T-Mobile | 3 | 216 | 3.4% | 4,180 | 3.9% | BBB+ | ||||||
Cigna/Evernorth | 2 | 244 | 3.8% | 3,966 | 3.7% | A- | ||||||
Encompass Health | 1 | 65 | 1.0% | 3,646 | 3.4% | BB | ||||||
Collins Aerospace | 1 | 207 | 3.3% | 3,587 | 3.3% | BBB+ | ||||||
AT&T | 1 | 203 | 3.2% | 3,484 | 3.3% | BBB | ||||||
Home Depot/HD Supply | 2 | 153 | 2.4% | 3,448 | 3.2% | A | ||||||
Top Ten Tenants | 29 | 2,686 | 42.3% | 64,817 | 60.6% | |||||||
Remaining Tenants: | ||||||||||||
Linde | 1 | 175 | 2.8% | 2,972 | 2.8% | A | ||||||
Maximus | 2 | 168 | 2.7% | 2,737 | 2.6% | BB+ | ||||||
Mercury One | 1 | 172 | 2.7% | 2,586 | 2.4% | NR | ||||||
Valent U.S.A. | 1 | 97 | 1.5% | 2,585 | 2.4% | NR | ||||||
Charter Communications | 1 | 156 | 2.5% | 2,476 | 2.3% | BB+ | ||||||
Brown University Health | 1 | 136 | 2.1% | 2,209 | 2.1% | NR | ||||||
GE Vernova | 1 | 152 | 2.4% | 2,117 | 2.0% | BBB | ||||||
Banner Life Insurance | 1 | 116 | 1.8% | 2,113 | 2.0% | A | ||||||
Day Pitney | 1 | 56 | 0.9% | 2,049 | 1.9% | NR | ||||||
Elementis | 1 | 66 | 1.0% | 1,980 | 1.9% | NR | ||||||
AGCO | 1 | 126 | 2.0% | 1,830 | 1.7% | BBB- | ||||||
FedEx | 1 | 90 | 1.4% | 1,623 | 1.5% | BBB | ||||||
Honeywell | 1 | 81 | 1.3% | 1,586 | 1.5% | A | ||||||
B&G Foods | 1 | 49 | 0.8% | 1,540 | 1.4% | B- | ||||||
Ifm Efector | 1 | 45 | 0.7% | 1,406 | 1.3% | NR | ||||||
Barilla America | 1 | 75 | 1.2% | 1,167 | 1.1% | NR | ||||||
Becton Dickinson | 1 | 50 | 0.8% | 1,116 | 1.0% | BBB | ||||||
Change Healthcare Operations | 1 | 55 | 0.9% | 1,097 | 1.0% | A+ | ||||||
Total | 48 | 4,551 | 71.8% | $100,006 | 93.5% |
See the Definitions section for a description of the Company's non-GAAP and operating metrics.
Orion Properties Inc. | WWW.ONLREIT.COM | 23
Q3 2026 SUPPLEMENTAL INFORMATION |
Tenant Industry Diversification (unaudited, square feet and dollars in thousands as of September 30, 2026) |
Industry | Number of Leases (1) | Occupied Square Feet | % of Total Rentable Square Feet | Annualized Base Rent | % of Total Annualized Base Rent | |||||
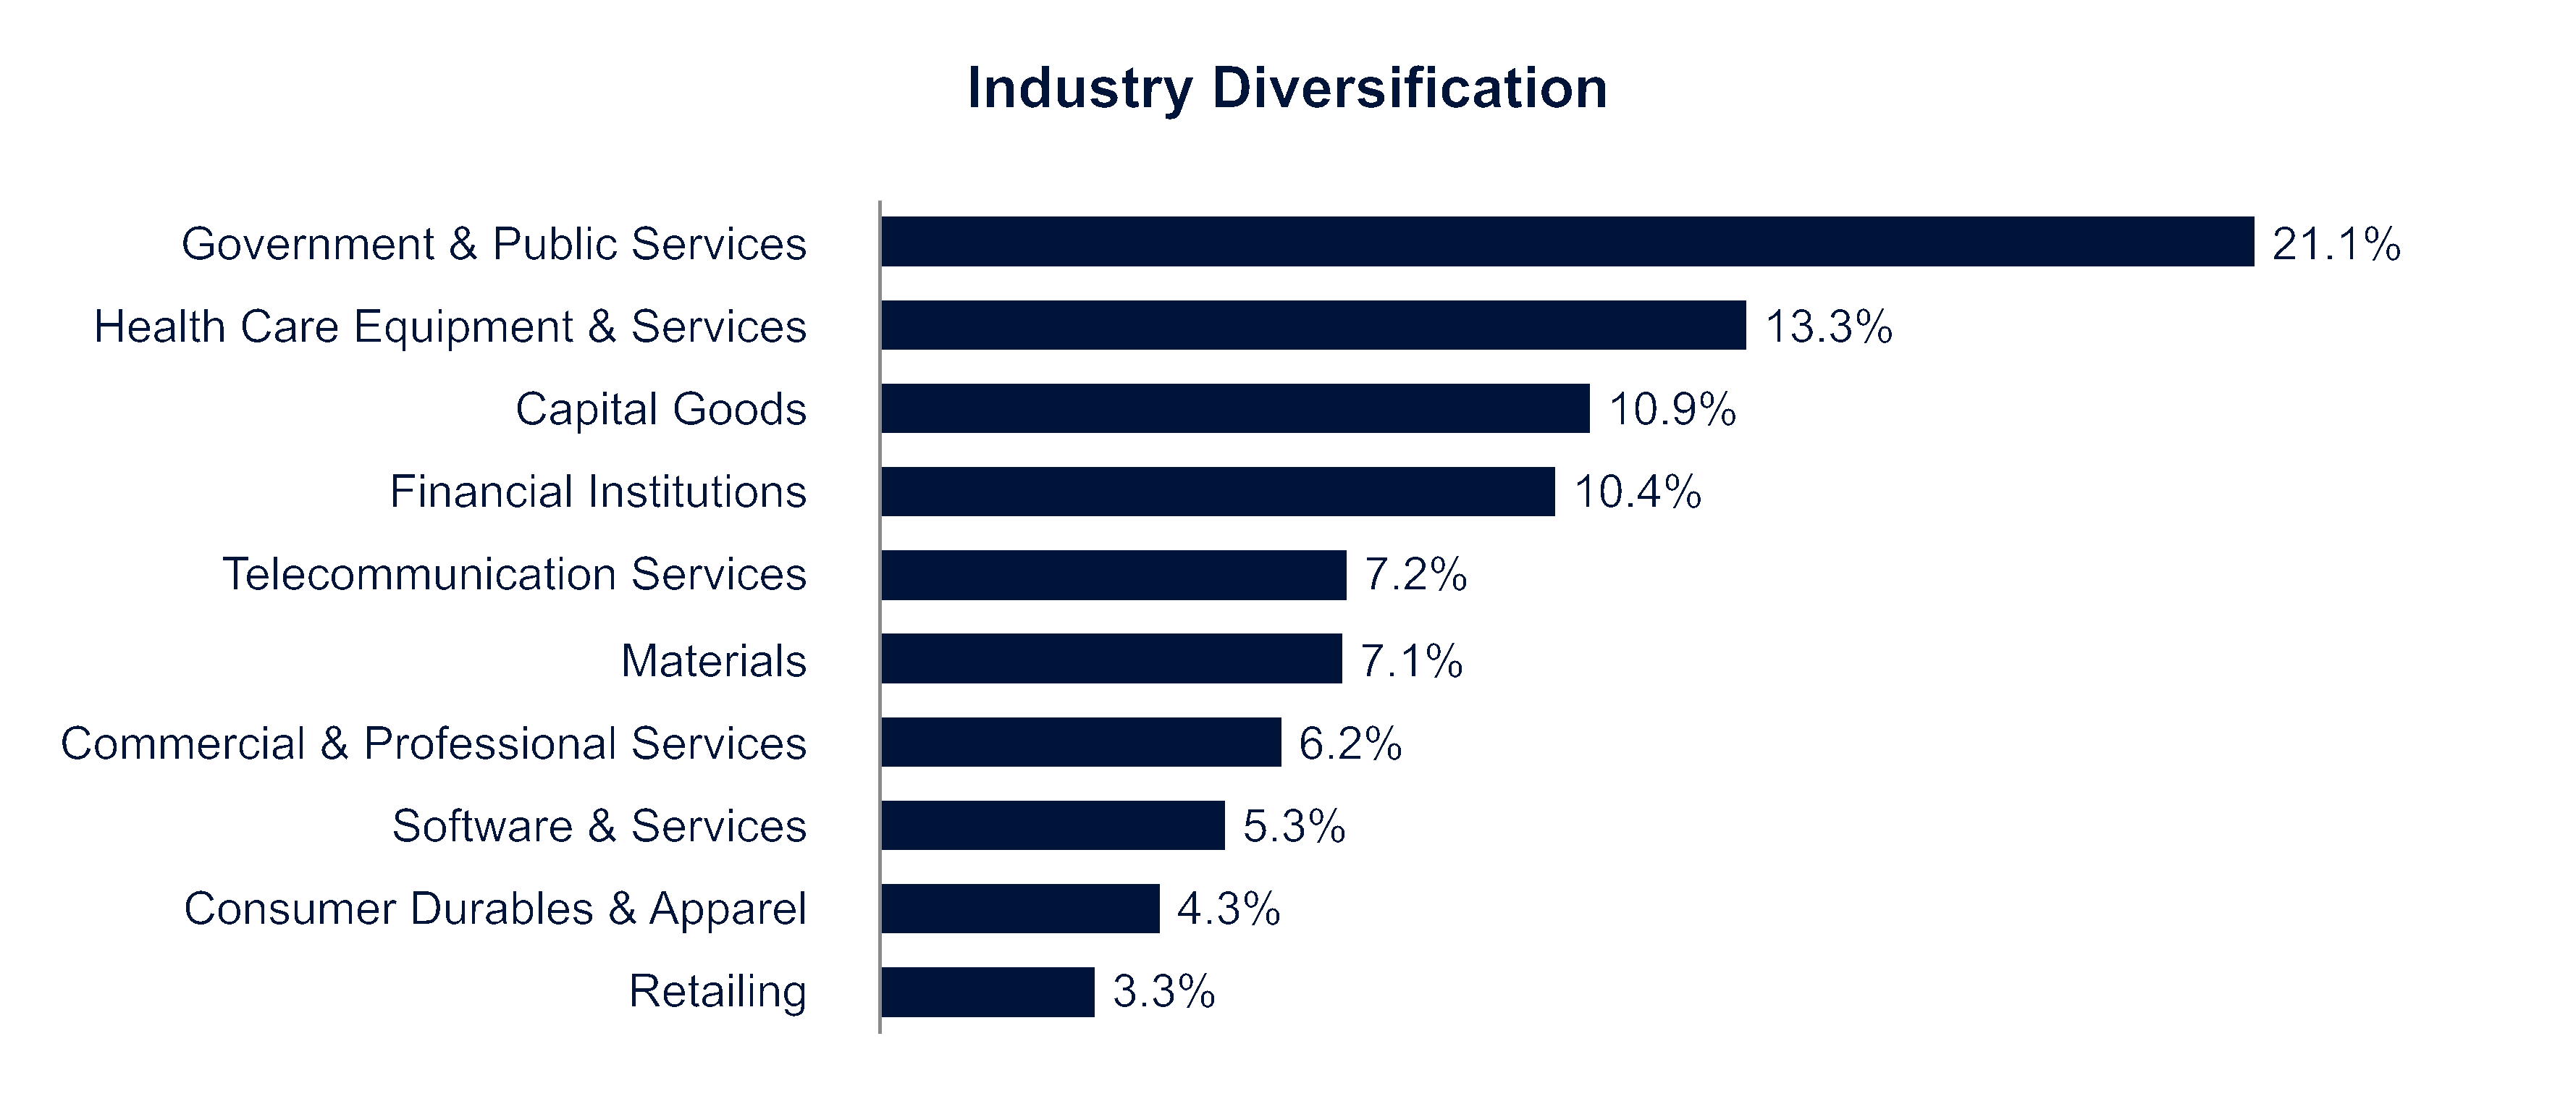
Government & Public Services | 18 | 854 | 13.4% | $22,573 | 21.1% | |||||
Health Care Equipment & Services | 11 | 703 | 11.1% | 14,205 | 13.3% | |||||
Capital Goods | 8 | 664 | 10.5% | 11,647 | 10.9% | |||||
Financial Institutions | 1 | 482 | 7.6% | 11,136 | 10.4% | |||||
Telecommunication Services | 4 | 419 | 6.6% | 7,664 | 7.2% | |||||
Materials | 4 | 343 | 5.4% | 7,636 | 7.1% | |||||
Commercial & Professional Services | 10 | 304 | 4.8% | 6,577 | 6.2% | |||||
Software & Services | 2 | 220 | 3.5% | 5,708 | 5.3% | |||||
Consumer Durables & Apparel | 1 | 145 | 2.3% | 4,562 | 4.3% | |||||
Retailing | 3 | 157 | 2.5% | 3,526 | 3.3% | |||||
Top Ten Tenant Industries | 62 | 4,291 | 67.7% | 95,234 | 89.1% | |||||
Remaining Tenant Industries: | ||||||||||
Food & Beverage | 2 | 124 | 1.9% | 2,707 | 2.5% | |||||
Charity & Non-Profit | 1 | 172 | 2.7% | 2,586 | 2.4% | |||||
Media & Entertainment | 1 | 156 | 2.5% | 2,476 | 2.3% | |||||
Insurance | 1 | 116 | 1.8% | 2,113 | 2.0% | |||||
Transportation | 1 | 90 | 1.4% | 1,623 | 1.5% | |||||
Restaurant | 5 | 20 | 0.3% | 228 | 0.2% | |||||
Real Estate | 1 | 2 | —% | 50 | —% | |||||
Total | 74 | 4,971 | 78.3% | $107,017 | 100.0% |
__________________________________
(1) The Company has certain Operating Properties that are subject to multiple leases.
See the Definitions section for a description of the Company's non-GAAP and operating metrics.
Orion Properties Inc. | WWW.ONLREIT.COM | 24
Q3 2026 SUPPLEMENTAL INFORMATION |
Lease Expirations (unaudited, square feet and dollars in thousands as of September 30, 2026) |
Year of Expiration | Number of Leases Expiring (1) | Occupied Square Feet | % of Total Rentable Square Feet | Annualized Base Rent | % of Total Annualized Base Rent | |||||
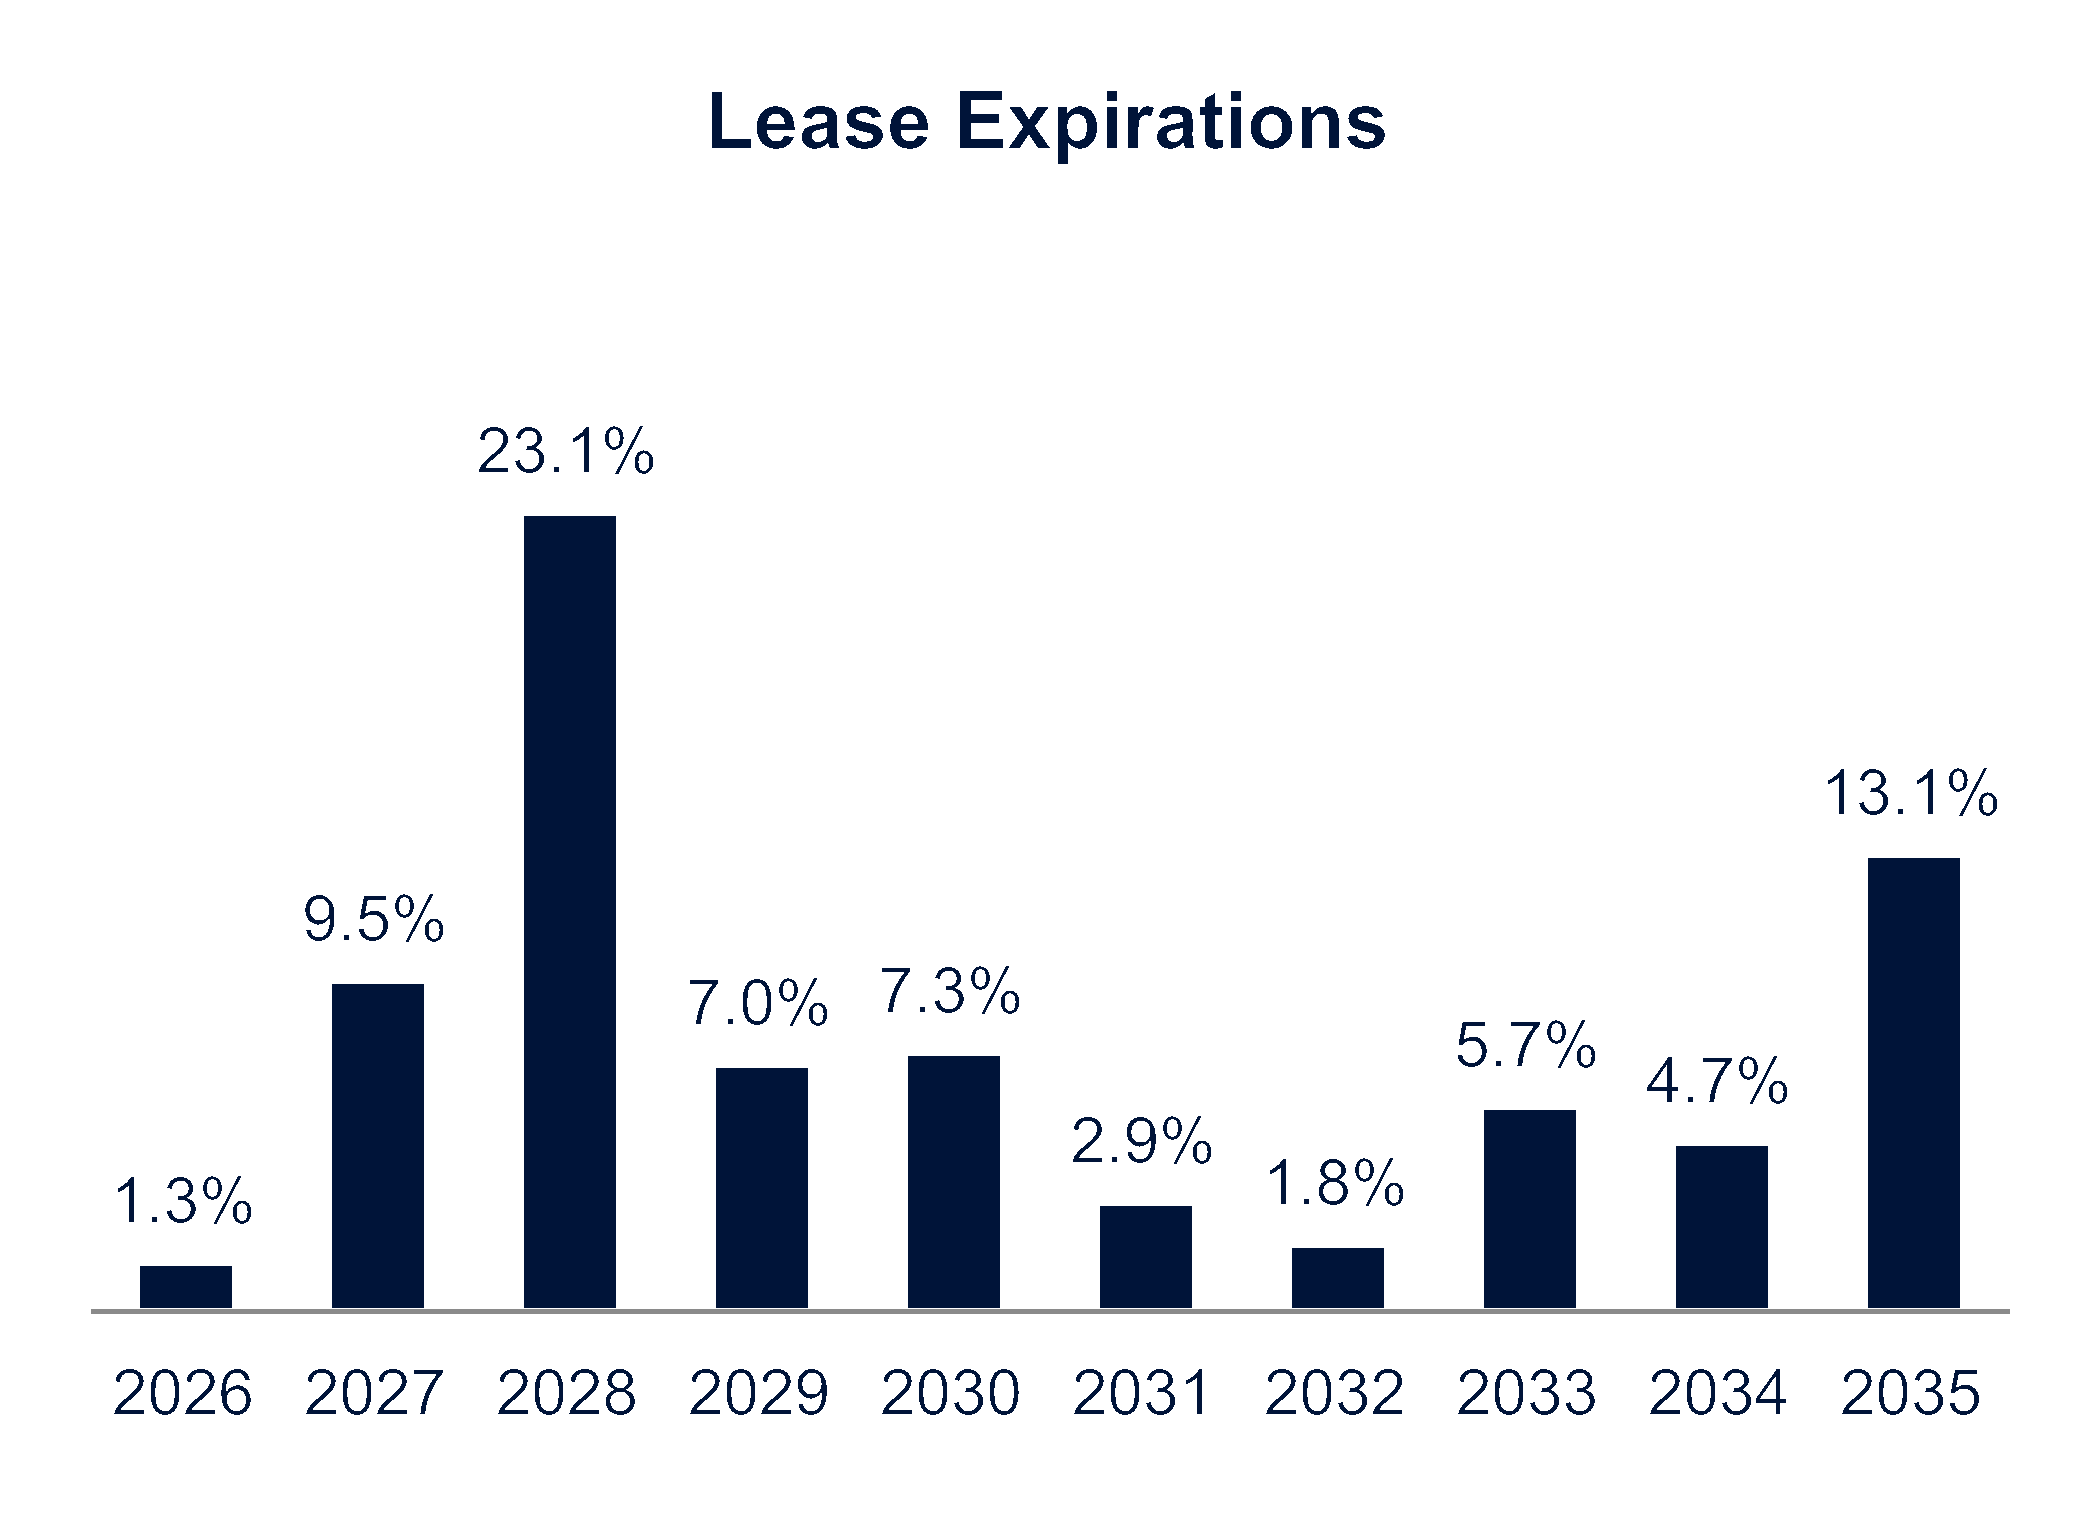
2026 | 2 | 45 | 0.7% | $1,364 | 1.3% | |||||
2027 | 8 | 586 | 9.2% | 10,163 | 9.5% | |||||
2028 | 13 | 1,073 | 16.9% | 24,685 | 23.1% | |||||
2029 | 7 | 427 | 6.7% | 7,492 | 7.0% | |||||
2030 | 7 | 277 | 4.4% | 7,814 | 7.3% | |||||
2031 | 6 | 98 | 1.6% | 3,077 | 2.9% | |||||
2032 | 2 | 83 | 1.3% | 1,908 | 1.8% | |||||
2033 | 4 | 297 | 4.7% | 6,045 | 5.7% | |||||
2034 | 6 | 305 | 4.8% | 5,071 | 4.7% | |||||
2035 | 3 | 614 | 9.7% | 14,028 | 13.1% | |||||
Thereafter | 16 | 1,166 | 18.3% | 25,370 | 23.6% | |||||
Total | 74 | 4,971 | 78.3% | $107,017 | 100.0% |
__________________________________
(1) The Company has certain Operating Properties that are subject to multiple leases.
See the Definitions section for a description of the Company's non-GAAP and operating metrics.
Orion Properties Inc. | WWW.ONLREIT.COM | 25
Q3 2026 SUPPLEMENTAL INFORMATION |
Lease Summary (unaudited, square feet and dollars in thousands as of September 30, 2026) |
Rent Escalations | Number of Leases (1) | Occupied Square Feet | % of Total Rentable Square Feet | Annualized Base Rent | % of Total Annualized Base Rent | |||||
Fixed Dollar or Percent Increase | 52 | 4,026 | 63.4% | $82,769 | 77.3% | |||||
GSA CPI | 15 | 775 | 12.2% | 21,272 | 19.9% | |||||
CPI | 1 | 81 | 1.3% | 1,586 | 1.5% | |||||
Flat | 6 | 89 | 1.4% | 1,390 | 1.3% | |||||
Total | 74 | 4,971 | 78.3% | $107,017 | 100.0% |
Tenant Expense Obligations | Number of Leases (1) | Occupied Square Feet | % of Total Rentable Square Feet | Annualized Base Rent | % of Total Annualized Base Rent | |||||
NN | 42 | 3,358 | 52.8% | $61,655 | 57.6% | |||||
Modified Gross | 24 | 1,319 | 20.8% | 37,762 | 35.3% | |||||
NNN | 6 | 284 | 4.5% | 7,495 | 7.0% | |||||
Gross | 2 | 10 | 0.2% | 105 | 0.1% | |||||
Total | 74 | 4,971 | 78.3% | $107,017 | 100.0% |
__________________________________
(1) The Company has certain Operating Properties that are subject to multiple leases.
See the Definitions section for a description of the Company's non-GAAP and operating metrics.
Orion Properties Inc. | WWW.ONLREIT.COM | 26
Q3 2026 SUPPLEMENTAL INFORMATION |
Operating Property Geographic Diversification (unaudited, square feet and dollars in thousands as of September 30, 2026) |
Location | Number of Properties | Rentable Square Feet | % of Total Rentable Square Feet | Annualized Base Rent | % of Total Annualized Base Rent | |||||
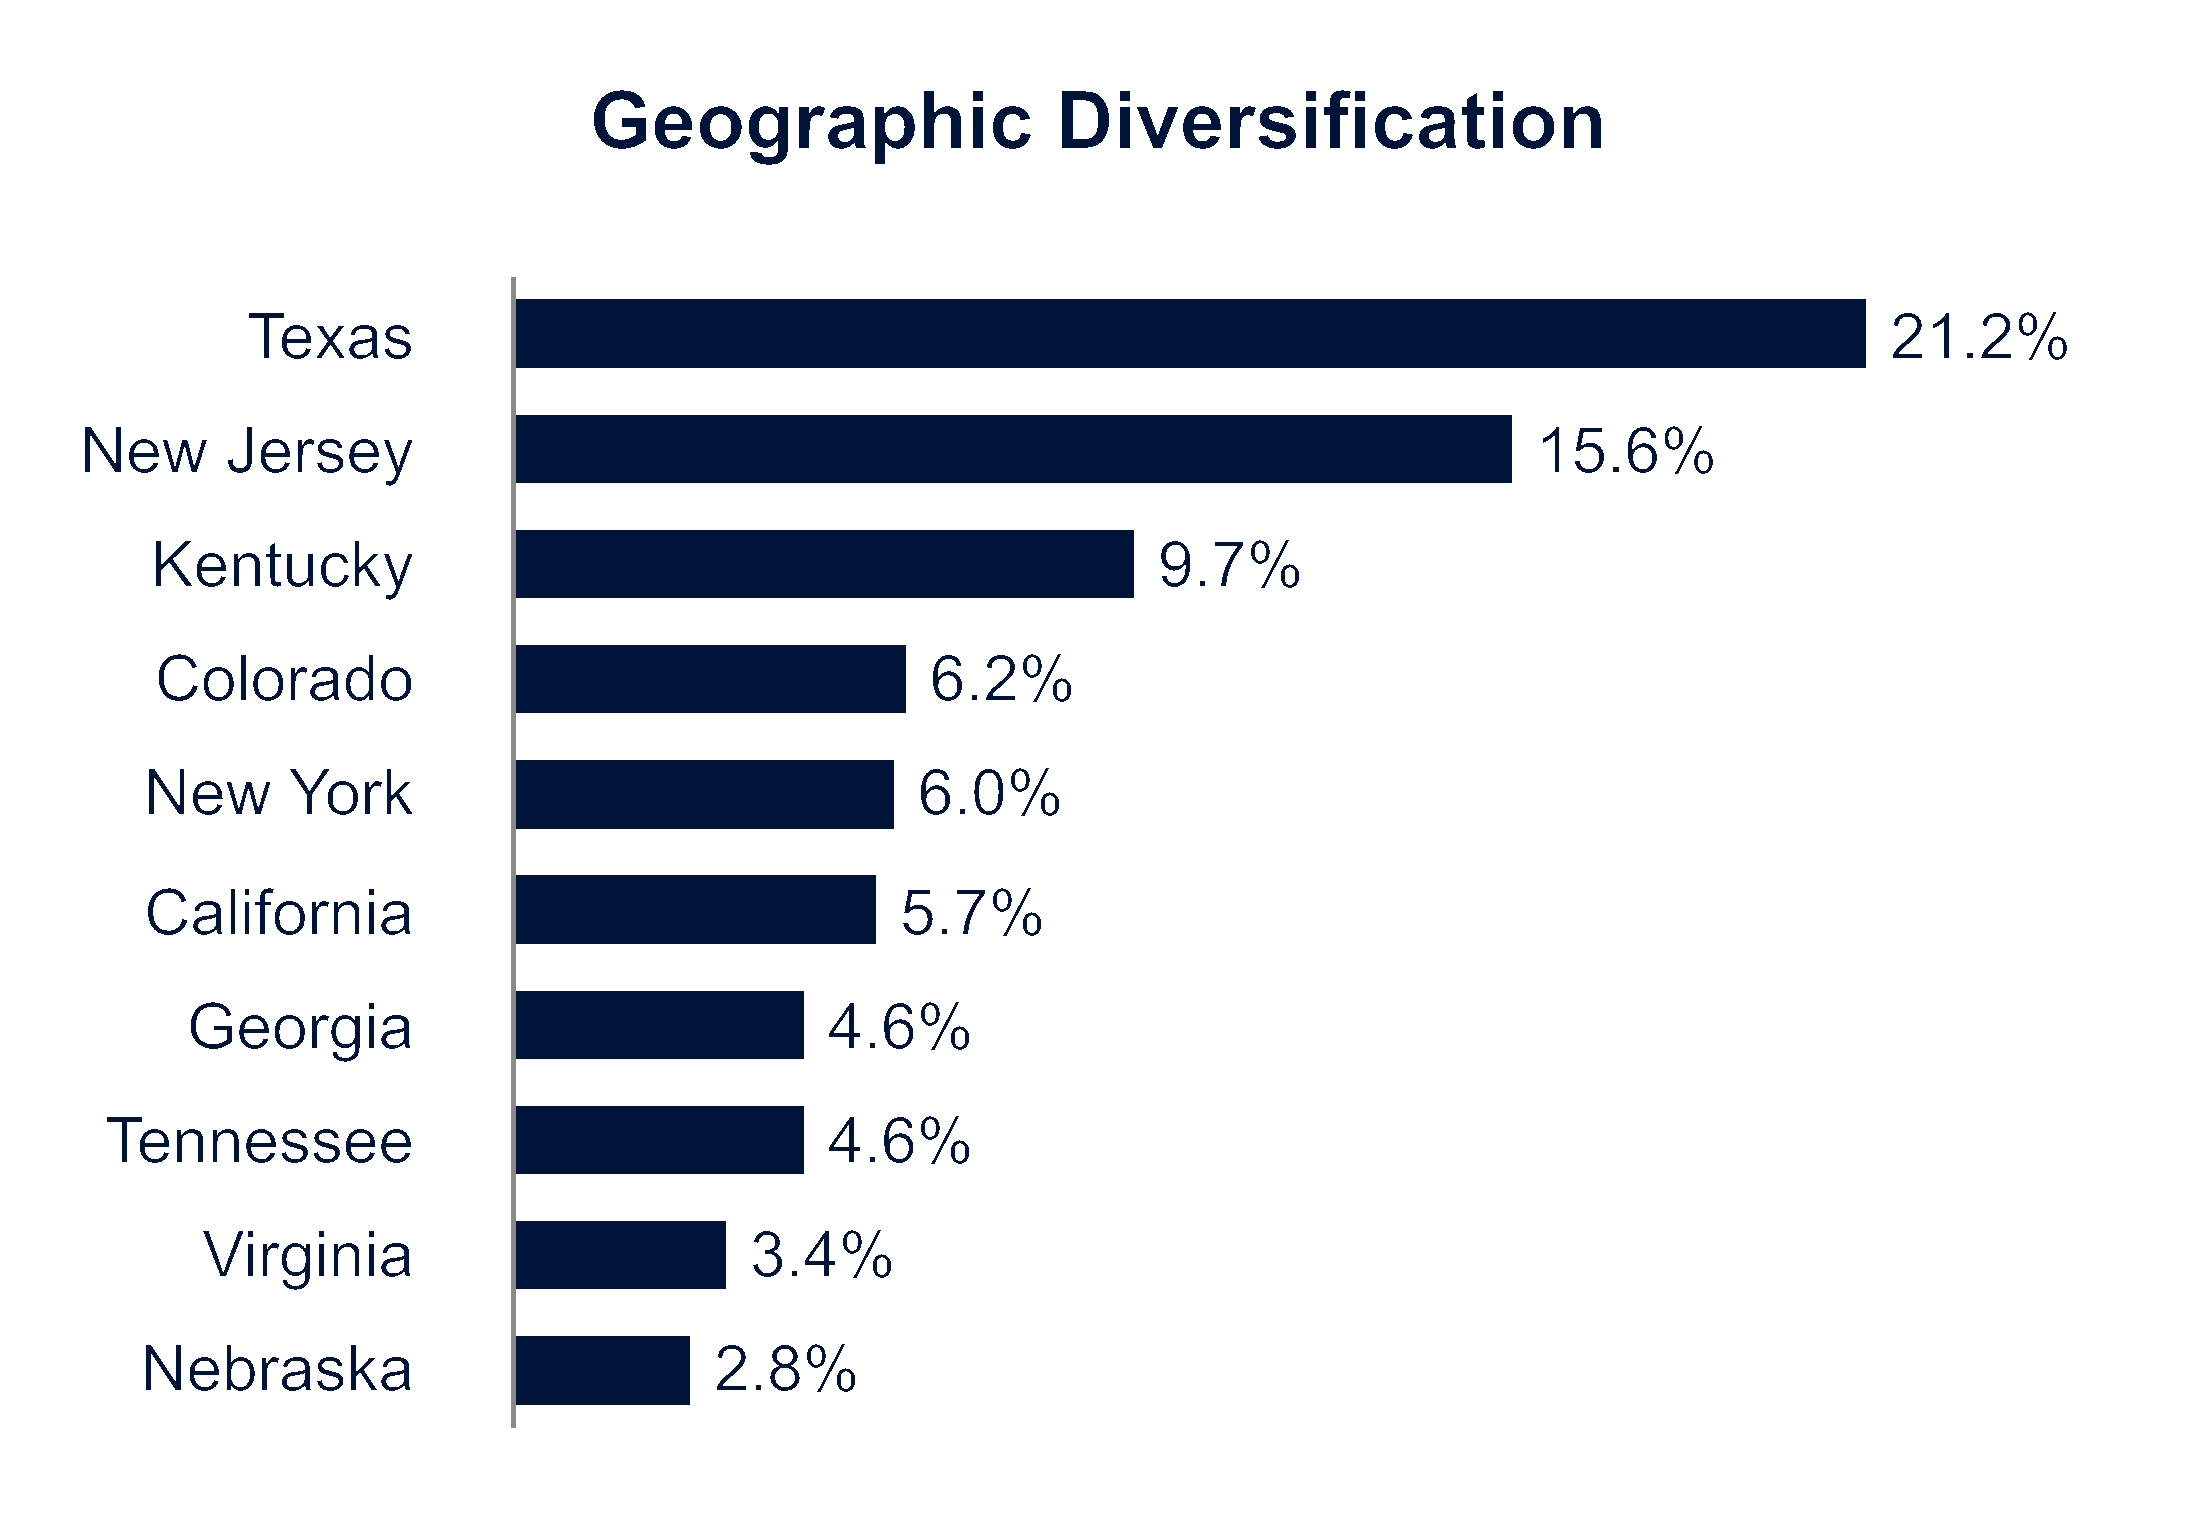
Texas | 15 | 1,351 | 21.2% | $22,764 | 21.2% | |||||
New Jersey | 3 | 714 | 11.2% | 16,705 | 15.6% | |||||
Kentucky | 1 | 438 | 6.9% | 10,350 | 9.7% | |||||
Colorado | 3 | 392 | 6.2% | 6,679 | 6.2% | |||||
New York | 6 | 756 | 11.9% | 6,466 | 6.0% | |||||
California | 3 | 214 | 3.4% | 6,065 | 5.7% | |||||
Georgia | 3 | 284 | 4.5% | 4,928 | 4.6% | |||||
Tennessee | 4 | 240 | 3.8% | 4,907 | 4.6% | |||||
Virginia | 1 | 207 | 3.3% | 3,587 | 3.4% | |||||
Nebraska | 1 | 150 | 2.4% | 2,971 | 2.8% | |||||
Top Ten States | 40 | 4,746 | 74.8% | 85,422 | 79.8% | |||||
Remaining States: | ||||||||||
Missouri | 1 | 181 | 2.8% | 2,692 | 2.5% | |||||
Wisconsin | 1 | 156 | 2.5% | 2,476 | 2.3% | |||||
Rhode Island | 1 | 136 | 2.1% | 2,209 | 2.1% | |||||
Maryland | 1 | 116 | 1.8% | 2,113 | 2.0% | |||||
Iowa | 2 | 92 | 1.4% | 2,089 | 1.9% | |||||
West Virginia | 1 | 63 | 1.0% | 1,475 | 1.4% | |||||
Pennsylvania | 1 | 45 | 0.7% | 1,406 | 1.3% | |||||
Oregon | 1 | 69 | 1.1% | 1,212 | 1.1% | |||||
Illinois | 1 | 75 | 1.2% | 1,167 | 1.1% | |||||
Kansas | 1 | 90 | 1.4% | 1,140 | 1.1% | |||||
Oklahoma | 1 | 330 | 5.2% | 866 | 0.8% | |||||
Idaho | 1 | 35 | 0.6% | 741 | 0.7% | |||||
Indiana | 1 | 83 | 1.3% | 664 | 0.6% | |||||
Arizona | 1 | 90 | 1.4% | 591 | 0.6% | |||||
Minnesota | 1 | 39 | 0.6% | 505 | 0.5% | |||||
Florida | 1 | 6 | 0.1% | 249 | 0.2% | |||||
Total | 57 | 6,352 | 100.0% | $107,017 | 100.0% |
See the Definitions section for a description of the Company's non-GAAP and operating metrics.
Orion Properties Inc. | WWW.ONLREIT.COM | 27
Q3 2026 SUPPLEMENTAL INFORMATION |
Operating Property Type (unaudited, square feet and dollars in thousands as of September 30, 2026) |
Property Type | Number of Properties | Rentable Square Feet | % of Total Rentable Square Feet | Annualized Base Rent | % of Total Annualized Base Rent | |||||
Traditional Office | 29 | 4,354 | 68.5% | $63,574 | 59.4% | |||||
Governmental | 17 | 938 | 14.8% | 23,552 | 22.0% | |||||
Flex/Industrial | 5 | 612 | 9.7% | 8,825 | 8.2% | |||||
Flex/Laboratory and R&D | 4 | 293 | 4.6% | 6,829 | 6.4% | |||||
Medical Office | 2 | 155 | 2.4% | 4,237 | 4.0% | |||||
Total | 57 | 6,352 | 100.0% | $107,017 | 100.0% |
See the Definitions section for a description of the Company's non-GAAP and operating metrics.
Orion Properties Inc. | WWW.ONLREIT.COM | 28
Q3 2026 SUPPLEMENTAL INFORMATION |
Operating Property Portfolio (unaudited, as of September 30, 2026 and Cash NOI for the trailing 12 months ended September 30, 2026) |
Industry | Address | Rentable Square Feet | Occupancy Rate | WALT | ABR | Trailing NOI (1) | Trailing Cash NOI (1) | |
Commercial & Professional Services | 4335 Paredes Line Road Brownsville, TX | 78 | 100.0% | 1.7 | $1,597 | $1,557 | $1,572 | (2) |
Telecommunication Services | 3750 Wheeler Road Augusta, GA | 78 | 100.0% | 6.0 | 1,781 | 1,501 | 1,685 | (2) |
Telecommunication Services | 4080 27th Court SE Salem, OR | 69 | 100.0% | 3.6 | 1,212 | 1,175 | 1,170 | (2) |
Health Care Equipment & Services | 8455 University Place Drive St. Louis, MO | 181 | 100.0% | 2.3 | 2,692 | 2,555 | 2,664 | (3) |
Government & Public Services | 2305 Hudson Boulevard Brownsville, TX | 11 | 100.0% | 7.4 | 354 | 131 | 179 | (3) |
Government & Public Services | 257 Bosley Industrial Park Parkersburg, WV | 63 | 100.0% | 12.6 | 1,475 | 1,104 | 1,147 | (2) |
Government & Public Services | 2805 Pine Mill Road Paris, TX | 11 | 100.0% | 4.9 | 437 | 248 | 257 | (3) |
Government & Public Services | 3381 U.S. Highway 277 Eagle Pass, TX | 20 | 100.0% | 11.5 | 562 | 286 | 298 | (2) |
Government & Public Services | 2475 Cliff Creek Crossing Dr Dallas, TX | 17 | 100.0% | 4.0 | 683 | 306 | 338 | (2) |
Government & Public Services | 3644 Avtech Parkway Redding, CA | 44 | 100.0% | 0.1 | 1,349 | 1,037 | 1,049 | (2) |
Government & Public Services | 5100 W 36th Street Minneapolis, MN | 39 | 100.0% | 3.6 | 505 | 491 | 494 | (2) |
Government & Public Services | 4525 State Route 11 Malone, NY | 29 | 100.0% | 4.8 | 1,036 | 565 | 634 | (3) |
Government & Public Services | 2600 Voyager Avenue Sioux City, IA | 11 | 100.0% | 0.8 | 503 | 217 | 271 | (2) |
Government & Public Services | 135 Circle Lane Knoxville, TN | 26 | 100.0% | 2.8 | 1,000 | 333 | 359 | (2) |
Health Care Equipment & Services | 2304 State Highway 121 Bedford, TX | 65 | 100.0% | 4.1 | 3,646 | 3,631 | 3,633 | (3) |
Government & Public Services | 3369 U.S. Highway 277 Eagle Pass, TX | 9 | 100.0% | 12.4 | 314 | 97 | 97 | (2) |
Transportation | 942 S. Shady Grove Road Memphis, TN | 90 | 100.0% | 8.3 | 1,623 | 1,746 | 1,605 | (3) |
Capital Goods | 601 Third Street SE Cedar Rapids, IA | 81 | 100.0% | 1.4 | 1,586 | 1,429 | 1,559 | (3) |
Health Care Equipment & Services | 15 LaSalle Square Providence, RI | 136 | 100.0% | 9.5 | 2,209 | 2,519 | 1,405 | (2) |
Materials | 100 Sci Park Boulevard East Windsor, NJ | 66 | 100.0% | 5.6 | 1,980 | 1,319 | 825 | (3) |
Vacant | 6005 Fair Lakes Road East Syracuse, NY | 109 | —% | — | — | 2,298 | 2,298 | (3) |
Government & Public Services | 310 Canaveral Groves Blvd Cocoa, FL | 6 | 100.0% | 1.4 | 249 | 102 | 102 | |
Government & Public Services | 103 & 104 Airport Road Grangeville, ID | 35 | 100.0% | 1.1 | 741 | 494 | 494 | |
Government & Public Services | 2901 Alta Mesa Boulevard Fort Worth, TX | 16 | 100.0% | 9.3 | 438 | 136 | 128 | (2) |
Government & Public Services | 59 Dunning Way Plattsburgh, NY | 13 | 100.0% | 7.0 | 585 | 343 | 345 | (2) |
Capital Goods | 1800 Nelson Road Longmont, CO | 152 | 100.0% | 8.0 | 2,117 | 2,335 | 2,253 | (2) |
Telecommunication Services | 2270 Lakeside Boulevard Richardson, TX | 203 | 100.0% | 0.5 | 3,484 | 3,380 | 3,535 | |
Health Care Equipment & Services | 5859 Farinon Drive San Antonio, TX | 96 | 52.1% | 1.0 | 1,116 | 833 | 871 | |
Commercial & Professional Services | 202 S. Cheyenne Tulsa, OK | 330 | 11.8% | 10.5 | 866 | (1,555) | (1,729) | (2) |
Consumer Durables & Apparel | 4350 South Monaco Street Denver, CO | 145 | 100.0% | 2.1 | 4,562 | 1,823 | 2,829 | (2) |
Vacant | 2250 Lakeside Boulevard Richardson, TX | 116 | —% | — | — | (740) | (740) | |
Commercial & Professional Services | 3833 Greenway Drive Lawrence, KS | 90 | 100.0% | 1.7 | 1,140 | 1,080 | 1,106 | (2) |
Materials | 1585 Sawdust Road The Woodlands, TX | 175 | 100.0% | 6.7 | 2,972 | 2,297 | 2,689 | (2) |
Vacant | 7390 S. Iola Street Englewood, CO | 95 | —% | — | — | (689) | (689) | (3) |
Media & Entertainment | 1254-1320 N. MLK Jr. Drive Milwaukee, WI | 156 | 100.0% | 0.5 | 2,476 | 2,380 | 2,354 | |
Telecommunication Services | 695 Grassmere Park Nashville, TN | 69 | 100.0% | 7.3 | 1,187 | 1,254 | 1,185 | (3) |
Commercial & Professional Services | 1575 Sawdust Road The Woodlands, TX | 153 | 79.1% | 2.6 | 2,512 | 2,041 | 2,080 | |
Retailing | 101 Riverview Parkway Santee, CA | 73 | 100.0% | 2.2 | 2,131 | 1,873 | 1,890 | (2) |
Charity & Non-Profit | 6655 North MacArthur Boulevard Irving, TX | 172 | 100.0% | 12.1 | 2,586 | 325 | (1,093) | (2) |
Government & Public Services | 333 Scott St & 300 Madison Ave Covington, KY | 438 | 96.3% | 1.9 | 10,350 | 6,206 | 6,051 | (2) |
Vacant | 1759 Wehrle Drive Amherst, NY | 170 | —% | — | — | 642 | 1,248 | |
Capital Goods | 22640 Davis Drive Sterling, VA | 207 | 100.0% | 2.6 | 3,587 | 3,475 | 3,522 | (3) |
Capital Goods | 1100 Atwater Drive, Lot 11A Malvern, PA | 45 | 100.0% | 5.1 | 1,406 | 1,389 | 1,447 | (3) |
Health Care Equipment & Services | 7353 Company Drive Indianapolis, IN | 83 | 100.0% | 1.0 | 664 | 613 | 605 | (2) |
See the Definitions section for a description of the Company's non-GAAP and operating metrics.
Orion Properties Inc. | WWW.ONLREIT.COM | 29
Q3 2026 SUPPLEMENTAL INFORMATION |
Health Care Equipment & Services | 1640 Dallas Parkway Plano, TX | 209 | 50.2% | 7.9 | $2,063 | $2,206 | $1,903 | (2) |
Government & Public Services | 777 Research Road Lincoln, NE | 150 | 96.7% | 4.9 | 2,971 | 1,679 | 5,066 | (2) |
Software & Services | 249 - 257 West Genesee Street Buffalo, NY | 405 | 41.0% | 12.5 | 4,845 | 2,309 | (564) | (2) |
Insurance | 3275 Bennett Creek Avenue Urbana, MD | 116 | 100.0% | 12.9 | 2,113 | 2,453 | 3,456 | (3) |
Health Care Equipment & Services | 100 Airpark Center Drive East Nashville, TN | 55 | 100.0% | 4.0 | 1,097 | 1,170 | 1,075 | (2) |
Retailing | 3074 Chastain Meadows Pkwy NW Kennesaw, GA | 80 | 100.0% | 1.5 | 1,317 | 1,510 | 1,731 | (3) (5) |
Capital Goods | 4205 River Green Parkway Duluth, GA | 126 | 100.0% | 14.8 | 1,830 | 2,289 | 1,285 | (3) |
Commercial & Professional Services | 8 Sylvan Way Parsippany, NJ | 166 | 63.3% | 14.6 | 3,589 | 150 | (1,052) | (2) |
Financial Institutions | 1500-1600 American Boulevard Hopewell, NJ | 482 | 100.0% | 9.2 | 11,136 | 11,082 | 6,580 | (3) |
Health Care Equipment & Services | 3003 N. 3rd Street Phoenix, AZ | 90 | 25.6% | 9.9 | 591 | (362) | (784) | (3) |
Vacant | 395 S. Youngs Road Amherst, NY | 30 | —% | — | — | (223) | (223) | |
Materials | 4600 Norris Canyon Road San Ramon, CA | 97 | 100.0% | 12.9 | 2,585 | 4,282 | 2,730 | (4) |
Food & Beverage | 885 Sunset Ridge Road Northbrook, IL | 75 | 100.0% | 10.3 | 1,167 | 779 | 727 | (2) |
__________________________________
(1)For certain properties, Trailing NOI and Trailing Cash NOI do not reflect a normalized full 12 months of rents due to factors such as lease expirations
or commencements, non-routine income and/or expenses (including reimbursements for end-of-lease obligations or capital reimbursements), and/or
recent acquisition of the property. Additional factors that may impact Trailing Cash NOI include contractual free rent periods and/or build-out periods
prior to rent commencement when the tenant has possession of the space. These factors have no effect on Annualized Base Rent.
(2)Property serving as collateral under the Company's credit facility revolver.
(3)Property serving as collateral for the Company's CMBS Loan.
(4)Property serving as collateral for the Company's San Ramon Loan.
(5)Property is currently subleased through March 2028, at which time the Company's lease with the sublease tenant will commence and is scheduled to
expire in August 2033.
See the Definitions section for a description of the Company's non-GAAP and operating metrics.
Orion Properties Inc. | WWW.ONLREIT.COM | 30
Q3 2026 SUPPLEMENTAL INFORMATION |
Unconsolidated Joint Venture Investment Summary (1) (unaudited, square feet and dollars in thousands) |
The following table summarizes the Company's investments in the Unconsolidated Joint Venture as of September 30, 2026.
Property | Tenant Industry | Weighted Average Remaining Lease Term | Proportionate Share of Gross Real Estate Investments | Proportionate Share of Rentable Square Feet | Proportionate Share of Annualized Base Rent | Proportionate Share of Principal Outstanding | ||||||
Schneider Electric - Foxboro, MA | Capital Goods | 1.2 | $4,206 | 50 | $757 | $4,662 | ||||||
Sysmex - Lincolnshire, IL | Health Care Equipment & Services | 10.1 | 5,935 | 33 | 844 | 4,739 | ||||||
DHL - Westerville, OH | Transportation | 5.3 | 4,896 | 29 | 466 | 3,638 | ||||||
Peraton - Herndon, VA | Software & Services | 3.3 | 5,287 | 33 | 1,243 | 5,195 | ||||||
Atlas Air - Erlanger, KY | Transportation | 9.5 | 4,399 | 20 | 337 | 2,836 | ||||||
Spire Energy - St. Louis, MO | Utilities | 8.4 | 4,423 | 26 | 394 | 3,283 | ||||||
5.6 | $29,146 | 191 | $4,041 | $24,353 |
__________________________________
(1)Beginning January 1, 2026, the Company no longer includes the proportionate share of the Unconsolidated Joint Venture's financial statement line
items and operating metrics in its non-GAAP financial results and other operating metrics. See "About the Data" above.
Orion Properties Inc. | WWW.ONLREIT.COM | 31
Q3 2026 SUPPLEMENTAL INFORMATION |
Definitions (unaudited, in thousands, except share and per share data) |
Annualized Base Rent ("ABR") is the monthly aggregate cash amount charged to tenants under our leases (including
monthly base rent receivables and certain fixed contractually obligated reimbursements by our tenants), as of the final date
of the applicable period, multiplied by 12. Annualized Base Rent is not indicative of future performance.
Average Capitalization Rate represents annualized average estimated Cash NOI of the property over the tenant's lease
term, excluding any rent concession periods credited at the date of purchase or sale, divided by gross purchase or sale
price, except that for certain triple and double net lease properties, the Average Capitalization Rate represents annualized
average estimated cash rental revenue of the property over the tenant’s lease term divided by gross purchase or sale price.
Cash Capitalization Rate represents next 12 full months estimated Cash NOI of the property, excluding any rent
concession periods credited at the date of purchase or sale, divided by gross purchase or sale price, except that for certain
triple and double net lease properties, the Cash Capitalization Rate represents next 12 full months estimated cash rental
revenue of the property divided by gross purchase or sale price.
CPI refers to a lease in which base rent is adjusted based on changes in a consumer price index.
Credit Rating of a tenant refers to the Standard & Poor's or Moody's credit rating and such rating also may reflect the rating
assigned by Standard & Poor's or Moody's to the lease guarantor or the parent company as applicable.
Dedicated Use Asset is a property that includes a substantial specialized use component such as government, medical,
laboratory and research and development, and flex operations, where tenants perform work that cannot be replicated from
home or relocated to a generic office setting, and would therefore not be considered a traditional office property.
Double Net Lease ("NN") is a lease under which the tenant agrees to pay all operating expenses associated with the
property (e.g., real estate taxes, insurance, maintenance), but excludes some or all major repairs (e.g., roof, structure,
parking lot, in each case, as further defined in the applicable lease).
Earnings Before Interest, Taxes, Depreciation and Amortization for Real Estate ("EBITDAre") and Adjusted EBITDA
Due to certain unique operating characteristics of real estate companies, as discussed below, the National Association of
Real Estate Investment Trusts, Inc. ("Nareit"), an industry trade group, has promulgated a supplemental performance
measure known as Earnings Before Interest, Taxes, Depreciation and Amortization for Real Estate. Nareit defines EBITDAre
as net income (loss) computed in accordance with GAAP, adjusted for interest expense, income tax expense (benefit),
depreciation and amortization, impairment write-downs on real estate and investments in entities when the impairment is
directly attributable to decreases in the value of depreciable real estate held by the entity and gains or losses from
disposition of real estate assets. For periods prior to January 1, 2026, we also adjust for our proportionate share of
EBITDAre adjustments related to the Unconsolidated Joint Venture. We calculated EBITDAre in accordance with Nareit's
definition described above.
In addition to EBITDAre, we use Adjusted EBITDA as a non-GAAP supplemental performance measure to evaluate the
operating performance of the Company. Adjusted EBITDA, as defined by the Company, represents EBITDAre, modified to
exclude non-routine items such as transaction related expenses. We also exclude certain non-cash items such as
impairments of intangible and right-of-use assets, changes in fair value of derivatives not designated as hedging
instruments, gains or losses on the extinguishment or forgiveness of debt, amortization of intangibles, above-market lease
assets and deferred lease incentives, net of amortization of below-market lease liabilities and, for periods prior to January 1,
2026, our proportionate share of Adjusted EBITDA adjustments related to the Unconsolidated Joint Venture. Management
believes that excluding these costs from EBITDAre provides investors with supplemental performance information that is
consistent with the performance models and analysis used by management, and provides investors a view of the
performance of our portfolio over time. Therefore, EBITDAre and Adjusted EBITDA should not be considered as an
alternative to net income (loss), as determined under GAAP. The Company uses Adjusted EBITDA as one measure of its
operating performance when formulating corporate goals and evaluating the effectiveness of the Company's strategies.
EBITDAre and Adjusted EBITDA may not be comparable to similarly titled measures of other companies.
Enterprise Value equals the sum of the Implied Equity Market Capitalization and Net Debt, in each case, as of an
applicable date.
Orion Properties Inc. | WWW.ONLREIT.COM | 32
Q3 2026 SUPPLEMENTAL INFORMATION |
Definitions (continued) (unaudited, in thousands, except share and per share data) |
Fixed Charge Coverage Ratio is (a) Adjusted EBITDA divided by (b) the sum of (i) Interest Expense, excluding non-cash
amortization and (ii) secured debt principal amortization on Adjusted Principal Outstanding. Management believes that Fixed
Charge Coverage Ratio is a useful supplemental measure of our ability to satisfy fixed financing obligations.
Fixed Dollar or Percent Increase refers to a lease that requires contractual rent increases during the term of the lease
agreement. A Fixed Dollar or Percent Increase lease may include a period of free rent at the beginning or end of the lease.
Flat refers to a lease that requires equal rent payments, with no contractual increases, throughout the term of the lease
agreement. A Flat lease may include a period of free rent at the beginning or end of the lease.
Funds Available for Distribution ("FAD")
Funds available for distribution, as defined by the Company, represents Core FFO, as defined below, modified to exclude
capital expenditures and leasing costs, as well as certain non-cash items such as amortization of above-market leases, net
of amortization of below-market lease liabilities, straight-line rental revenue, and, for periods prior to January 1, 2026, our
proportionate share of FAD adjustments related to the Unconsolidated Joint Venture and amortization of the Unconsolidated
Joint Venture basis difference. Management believes that adjusting these items from Core FFO provides investors with
supplemental performance information that is consistent with the performance models and analysis used by management
and provides useful information regarding the Company's ability to fund its dividend.
However, not all REITs calculate FAD and those that do may not calculate FAD the same way, so comparisons with other
REITs may not be meaningful. FAD should not be considered as an alternative to net income (loss) or cash flow provided by
(used in) operating activities as determined under GAAP.
Nareit Funds from Operations ("Nareit FFO" or "FFO") and Core Funds from Operations ("Core FFO")
Due to certain unique operating characteristics of real estate companies, as discussed below, Nareit has promulgated a
supplemental performance measure known as FFO, which we believe to be an appropriate supplemental performance
measure to reflect the operating performance of the Company. FFO is not equivalent to our net income (loss) as determined
under GAAP.
Nareit defines FFO as net income (loss) computed in accordance with GAAP adjusted for gains or losses from disposition of
real estate assets, depreciation and amortization of real estate assets, impairment write-downs on real estate and
investments in entities when the impairment is directly attributable to decreases in the value of depreciable real estate held
by the entity. For periods prior to January 1, 2026, we also adjust for our proportionate share of FFO adjustments related to
the Unconsolidated Joint Venture. We calculate FFO in accordance with Nareit's definition described above.
In addition to FFO, we use Core FFO as a non-GAAP supplemental financial performance measure to evaluate the
operating performance of the Company. Core FFO, as defined by the Company, excludes from FFO items that we believe
do not reflect the ongoing operating performance of our business such as transaction related expenses, amortization of
deferred financing costs, amortization of deferred lease incentives, net, equity-based compensation, amortization of
premiums and discounts on debt, net, gains or losses on extinguishment of swaps and/or debt, changes in fair value of
derivatives not designated as hedging instruments, and, for periods prior to January 1, 2026, our proportionate share of
Core FFO adjustments related to the Unconsolidated Joint Venture.
We believe that FFO and Core FFO allow for a comparison of the performance of our operations with other publicly-traded
REITs, as FFO and Core FFO, or a substantially similar measure, are routinely reported by publicly-traded REITs, each
adjust for items that we believe do not reflect the ongoing operating performance of our business and we believe are often
used by analysts and investors for comparison purposes.
For all of these reasons, we believe FFO and Core FFO, in addition to net income (loss), as determined under GAAP, are
helpful supplemental performance measures and useful in understanding the various ways in which our management
evaluates the performance of the Company over time. However, not all REITs calculate FFO and Core FFO the same way,
so comparisons with other REITs may not be meaningful. FFO and Core FFO should not be considered as alternatives to
net income (loss) and are not intended to be used as a liquidity measure indicative of cash flow available to fund our cash
needs. Neither the SEC, Nareit, nor any other regulatory body has evaluated the acceptability of the exclusions used to
adjust FFO in order to calculate Core FFO and its use as a non-GAAP financial performance measure.
Orion Properties Inc. | WWW.ONLREIT.COM | 33
Q3 2026 SUPPLEMENTAL INFORMATION |
Definitions (continued) (unaudited, in thousands, except share and per share data) |
GAAP is an abbreviation for generally accepted accounting principles in the United States.
Gross Lease is a lease under which the landlord is responsible for all expenses associated with the property (e.g., real
estate taxes, insurance, maintenance and repairs).
Gross Real Estate Investments represent total gross real estate and related assets of Operating Properties, net of gross
intangible lease liabilities and, for periods prior to January 1, 2026, the Company's proportionate share of such amounts
related to properties owned by the Unconsolidated Joint Venture. Gross Real Estate Investments should not be considered
as an alternative to the Company's real estate investments balance as determined under GAAP or any other GAAP financial
measures and should only be considered together with, and as a supplement to, the Company's financial information
prepared in accordance with GAAP.
The following table shows a reconciliation of Gross Real Estate Investments to the amounts presented in accordance with
GAAP on the balance sheets for the periods presented (in thousands):
September 30, 2026 | June 30, 2026 | March 31, 2026 | December 31, 2025 | September 30, 2025 | ||||||
Total real estate investments, at cost - as reported | $1,129,917 | $1,124,136 | $1,162,759 | $1,153,208 | $1,174,249 | |||||
Adjustments: | ||||||||||
Gross intangible lease assets | 248,873 | 249,507 | 261,557 | 250,204 | 253,127 | |||||
Gross intangible lease liabilities | (38,660) | (38,660) | (38,660) | (38,660) | (38,660) | |||||
Non-Operating Properties total real estate investments, at cost | — | — | (11,113) | (11,113) | (11,113) | |||||
Proportionate share of Unconsolidated Joint Venture Gross Real Estate Investments | — | — | — | 29,118 | 46,092 | |||||
Gross Real Estate Investments | $1,340,130 | $1,334,983 | $1,374,543 | $1,382,757 | $1,423,695 |
GSA CPI refers to a General Services Administration ("GSA") lease that includes a contractually obligated operating cost
component of rent which is adjusted annually based on changes in a consumer price index.
Implied Equity Market Capitalization equals shares of common stock outstanding as of an applicable date, multiplied by
the closing sale price of the Company's stock as reported on the New York Stock Exchange on such date.
Industry is derived from the Global Industry Classification Standard ("GICS") Methodology that was developed by Morgan
Stanley Capital International ("MSCI") in collaboration with S&P Dow Jones Indices to establish a global, accurate, complete
and widely accepted approach to defining industries and classifying securities by industry.
Interest Coverage Ratio equals Adjusted EBITDA divided by Interest Expense, excluding non-cash amortization.
Management believes that Interest Coverage Ratio is a useful supplemental measure of our ability to service our debt
obligations.
Interest Expense, excluding non-cash amortization is a non-GAAP measure that represents interest expense incurred
on the outstanding principal balance of our debt and, for periods prior to January 1, 2026, the Company's proportionate
share of the Unconsolidated Joint Venture's interest expense incurred on its outstanding principal balance. This measure
excludes the amortization of deferred financing costs, premiums and discounts, which is included in interest expense in
accordance with GAAP. Interest Expense, excluding non-cash amortization should not be considered as an alternative to
the Company's interest expense as determined under GAAP or any other GAAP financial measures and should only be
considered together with and as a supplement to the Company's financial information prepared in accordance with GAAP.
Orion Properties Inc. | WWW.ONLREIT.COM | 34
Q3 2026 SUPPLEMENTAL INFORMATION |
Definitions (continued) (unaudited, in thousands, except share and per share data) |
The following table shows a reconciliation of Interest Expense, excluding non-cash amortization to interest expense
presented in accordance with GAAP on the statements of operations for the periods presented (in thousands):
Three Months Ended | ||||||||||
September 30, 2026 | June 30, 2026 | March 31, 2026 | December 31, 2025 | September 30, 2025 | ||||||
Interest expense, net - as reported | $7,099 | $7,330 | $7,250 | $7,473 | $7,880 | |||||
Adjustments: | ||||||||||
Amortization of deferred financing costs and other non- cash charges | (1,081) | (928) | (845) | (932) | (933) | |||||
Proportionate share of Unconsolidated Joint Venture Interest Expense, excluding non-cash amortization | — | — | — | 487 | 516 | |||||
Interest Expense, excluding non-cash amortization | $6,018 | $6,402 | $6,405 | $7,028 | $7,463 | |||||
Investment-Grade Tenants are those with a Credit Rating of BBB- or higher from Standard & Poor's or a Credit Rating of
Baa3 or higher from Moody's. The ratings may reflect those assigned by Standard & Poor's or Moody's to the lease
guarantor or the parent company, as applicable.
Leased Rate equals the sum of Leased Square Feet divided by Rentable Square Feet as of an applicable date.
Leased Square Feet is Rentable Square Feet leased for which revenue recognition has commenced in accordance with
GAAP and signed leases for vacant space with future commencement dates.
Modified Gross Lease is a lease under which the landlord is responsible for most expenses associated with the property
(e.g., real estate taxes, insurance, maintenance and repairs), but passes through some operating expenses to the tenant.
Month-to-Month refers to a lease that is outside of the contractual lease expiration, but the tenant has not vacated and
continues to pay rent which may also include holdover rent if applicable.
Net Debt, Principal Outstanding and Adjusted Principal Outstanding
Principal Outstanding is a non-GAAP measure that represents the Company's outstanding principal debt balance, excluding
certain GAAP adjustments, such as premiums and discounts, financing and issuance costs, and related accumulated
amortization. For periods prior to January 1, 2026, Adjusted Principal Outstanding includes the Company's proportionate
share of the Unconsolidated Joint Venture's outstanding principal debt balance. We believe that the presentation of Principal
Outstanding and Adjusted Principal Outstanding, which show our contractual debt obligations, provides useful information to
investors to assess our overall financial flexibility, capital structure and leverage. Principal Outstanding and Adjusted
Principal Outstanding should not be considered as alternatives to the Company's consolidated debt balance as determined
under GAAP or any other GAAP financial measures and should only be considered together with, and as a supplement to,
the Company's financial information prepared in accordance with GAAP.
Net Debt is a non-GAAP measure used to show the Company's Adjusted Principal Outstanding, less all cash and cash
equivalents and, for periods prior to January 1, 2026, the Company's proportionate share of the Unconsolidated Joint
Venture's cash and cash equivalents. Beginning January 1, 2026, the Company has revised its definition and calculation of
Net Debt to also add restricted cash to the amounts that reduce the Company's Adjusted Principal Outstanding under debt
obligations. This change in definition has also been applied retrospectively for comparison purposes and, for periods prior to
January 1, 2026, also includes the Company's proportionate share of restricted cash from the Unconsolidated Joint Venture.
We believe that the presentation of Net Debt provides useful information to investors because our management reviews Net
Debt as part of its management of our overall liquidity, financial flexibility, capital structure and leverage.
Orion Properties Inc. | WWW.ONLREIT.COM | 35
Q3 2026 SUPPLEMENTAL INFORMATION |
Definitions (continued) (unaudited, in thousands, except share and per share data) |
The following table shows a reconciliation of Net Debt, Principal Outstanding and Adjusted Principal Outstanding to the
amounts presented in accordance with GAAP on the balance sheets for the periods presented (in thousands):
September 30, 2026 | June 30, 2026 | March 31, 2026 | December 31, 2025 | September 30, 2025 | ||||||
Mortgages payable, net | $331,955 | $331,802 | $366,927 | $371,957 | $371,772 | |||||
Credit facility revolver | 102,000 | 102,000 | 127,000 | 92,000 | 110,000 | |||||
Total debt - as reported | 433,955 | 433,802 | 493,927 | 463,957 | 481,772 | |||||
Deferred financing costs, net | 2,539 | 2,796 | 3,351 | 1,043 | 1,228 | |||||
Principal Outstanding | 436,494 | 436,598 | 497,278 | 465,000 | 483,000 | |||||
Proportionate share of Unconsolidated Joint Venture Principal Outstanding | — | — | — | 25,753 | 25,897 | |||||
Adjusted Principal Outstanding | $436,494 | $436,598 | $497,278 | $490,753 | $508,897 | |||||
Cash and cash equivalents | (13,731) | (16,870) | (10,274) | (22,362) | (32,639) | |||||
Restricted cash | (50,450) | (46,659) | (50,259) | (38,277) | (30,126) | |||||
Proportionate share of Unconsolidated Joint Venture cash and cash equivalents | — | — | — | (495) | (394) | |||||
Proportionate share of Unconsolidated Joint Venture restricted cash | — | — | — | (1,580) | (1,570) | |||||
Net Debt | $372,313 | $373,069 | $436,745 | $428,039 | $444,168 |
Net Debt Leverage Ratio equals Net Debt divided by Gross Real Estate Investments. Beginning in 2026, the Company has
revised its definition and calculation of Net Debt to also add restricted cash to the amounts that reduce the Company's
Adjusted Principal Outstanding under debt obligations. This change in definition has also been applied retrospectively for
comparison purposes and, for periods prior to January 1, 2026, also includes the Company's proportionate share of
restricted cash from the Unconsolidated Joint Venture.
Net Operating Income ("NOI"), Cash NOI, Trailing NOI and Trailing Cash NOI
NOI is a non-GAAP performance measure used to evaluate the operating performance of a real estate company. NOI
represents total revenues less property operating expenses and excludes fee revenue earned for services to the
Unconsolidated Joint Venture, impairment, depreciation and amortization, general and administrative expenses, and
transaction related expenses. Cash NOI excludes the impact of certain GAAP adjustments included in rental revenue, such
as straight-line rental revenue, amortization of above-market intangible lease assets and below-market lease intangible
liabilities, and amortization of deferred lease incentives. For periods prior to January 1, 2026, Cash NOI includes the
proportionate share of such amounts from properties owned by the Unconsolidated Joint Venture. Trailing NOI and Trailing
Cash NOI represent trailing 12-month NOI and Cash NOI, calculated for the most recent 12-month period as of the
applicable date. It is management's view that NOI and Cash NOI provide investors relevant and useful information because
it reflects only income and operating expense items that are incurred at the property level and presents them on an
unleveraged basis. NOI and Cash NOI should not be considered as an alternative to operating income in accordance with
GAAP. Further, NOI and Cash NOI may not be comparable to similarly titled measures of other companies.
Orion Properties Inc. | WWW.ONLREIT.COM | 36
Q3 2026 SUPPLEMENTAL INFORMATION |
Definitions (continued) (unaudited, in thousands, except share and per share data) |
The following table shows the calculation of NOI and Cash NOI for the periods presented (in thousands):
Three Months Ended | ||||||||||
September 30, 2026 | June 30, 2026 | March 31, 2026 | December 31, 2025 | September 30, 2025 | ||||||
Total revenues | $35,433 | $34,304 | $36,271 | $35,219 | $37,122 | |||||
Less: total operating expenses | (31,655) | (30,920) | (39,637) | (49,369) | (100,412) | |||||
Fee income from Unconsolidated Joint Venture | (198) | (206) | (137) | (209) | (204) | |||||
Transaction related | 120 | 312 | 259 | 645 | 114 | |||||
General and administrative | 4,735 | 4,611 | 5,140 | 5,972 | 4,607 | |||||
Depreciation and amortization | 12,518 | 13,520 | 13,159 | 13,087 | 14,709 | |||||
Impairment of real estate assets | — | — | 6,296 | 14,466 | 63,698 | |||||
NOI | 20,953 | 21,621 | 21,351 | 19,811 | 19,634 | |||||
Straight-line rental revenue | (3,109) | (2,998) | 1,830 | (2,077) | (4,898) | |||||
Amortization of above and below market leases, net | (279) | (312) | (312) | (312) | (312) | |||||
Amortization of deferred lease incentives, net | 207 | 221 | 162 | 136 | 175 | |||||
Other non-cash adjustments | 33 | 47 | 48 | 48 | 48 | |||||
Proportionate share of Unconsolidated Joint Venture Cash NOI | — | — | — | 893 | 900 | |||||
Cash NOI | $17,805 | $18,579 | $23,079 | $18,499 | $15,547 | |||||
Non-Operating Properties refers to all properties owned and consolidated by the Company as of the applicable date which
have been excluded from Operating Properties due to the properties being vacant and repositioned, redeveloped,
developed or held for sale.
Occupancy Rate equals the sum of Occupied Square Feet divided by Rentable Square Feet as of an applicable date.
Occupied Square Feet is Rentable Square Feet leased for which revenue recognition has commenced in accordance with
GAAP.
Operating Properties refers to all properties owned and consolidated by the Company as of the applicable date, excluding
Non-Operating Properties.
Property Operating Expense includes reimbursable and non-reimbursable costs to operate a property, including real
estate taxes, utilities, insurance, repairs, maintenance, legal, property management fees, etc.
Rentable Square Feet is leasable square feet of Operating Properties.
Triple Net Lease ("NNN") is a lease under which the tenant agrees to pay all expenses associated with the property (e.g.,
real estate taxes, insurance, maintenance and repairs in accordance with the lease terms).
Unconsolidated Joint Venture means the Company's investment in an unconsolidated joint venture with an affiliate of Arch
Street Capital Partners, LLC.
Weighted Average Remaining Lease Term ("WALT") is the number of years remaining on each respective lease as of
the applicable date, weighted based on Annualized Base Rent.