View the latest presentation

Orion’s Diversified Portfolio is Supported by Significant Investment Grade Tenant Exposure
The Orion portfolio consists of 63 wholly-owned Operating Properties and 6 unconsolidated Joint Venture properties diversified by tenant, geography and industry. None of Orion’s tenants represent more than 18% of the portfolio by ABR. The diversity of Orion’s portfolio and the high credit quality nature of the tenancy are expected to provide the company with a strong, stable source of recurring cash flow from which to grow the business.
The portfolio is cycle-tested and its rent collection rate during the pandemic demonstrates the creditworthiness of the tenant base and our ability to continue to occupy these key office locations. The portfolio has 67% investment grade tenancy by ABR as of September 30, 2025.
A Distinct Investment Thesis
Orion is uniquely positioned within the net lease REIT sector through its focus on single-tenant, office-oriented dedicated use assets. This strategy sets Orion apart as it shifts away from traditional office toward more specialized, purpose-driven properties
Explore Orion’s Investment ThesisTop 10 Tenants
As of September 30, 2025, the top ten tenants as measured by Annualized Base Rent (ABR) are as follows:| Tenant | Credit Rating(1) | Percentage of ABR (as of 9.30.25) |
|---|---|---|
| Government Services Administration | AA+ | 17.4% |
| Merrill Lynch | A- | 9.8% |
| Ingram Micro | BB | 6.8% |
| Cigna/Express Scripts | A- | 4.3% |
| Sekisui House | BBB | 3.9% |
| T-Mobile | BBB | 3.6% |
| Charter Communications | BB+ | 3.4% |
| Banner Life Insurance | A | 3.3% |
| Encompass Health | BB | 3.1% |
| Collins Aerospace | BBB+ | 3.1% |
(1) S&P credit ratings (or equivalent if Moody’s credit rating); parent company credit ratings shown where applicable.
Industry Diversification
Orion’s tenants operate in a wide range of industries, including financial services, health care, government services and telecommunications.
As of September 30, 2025, the top ten tenant industries as measured by Annualized Base Rent are as follows:
Geographic Diversification
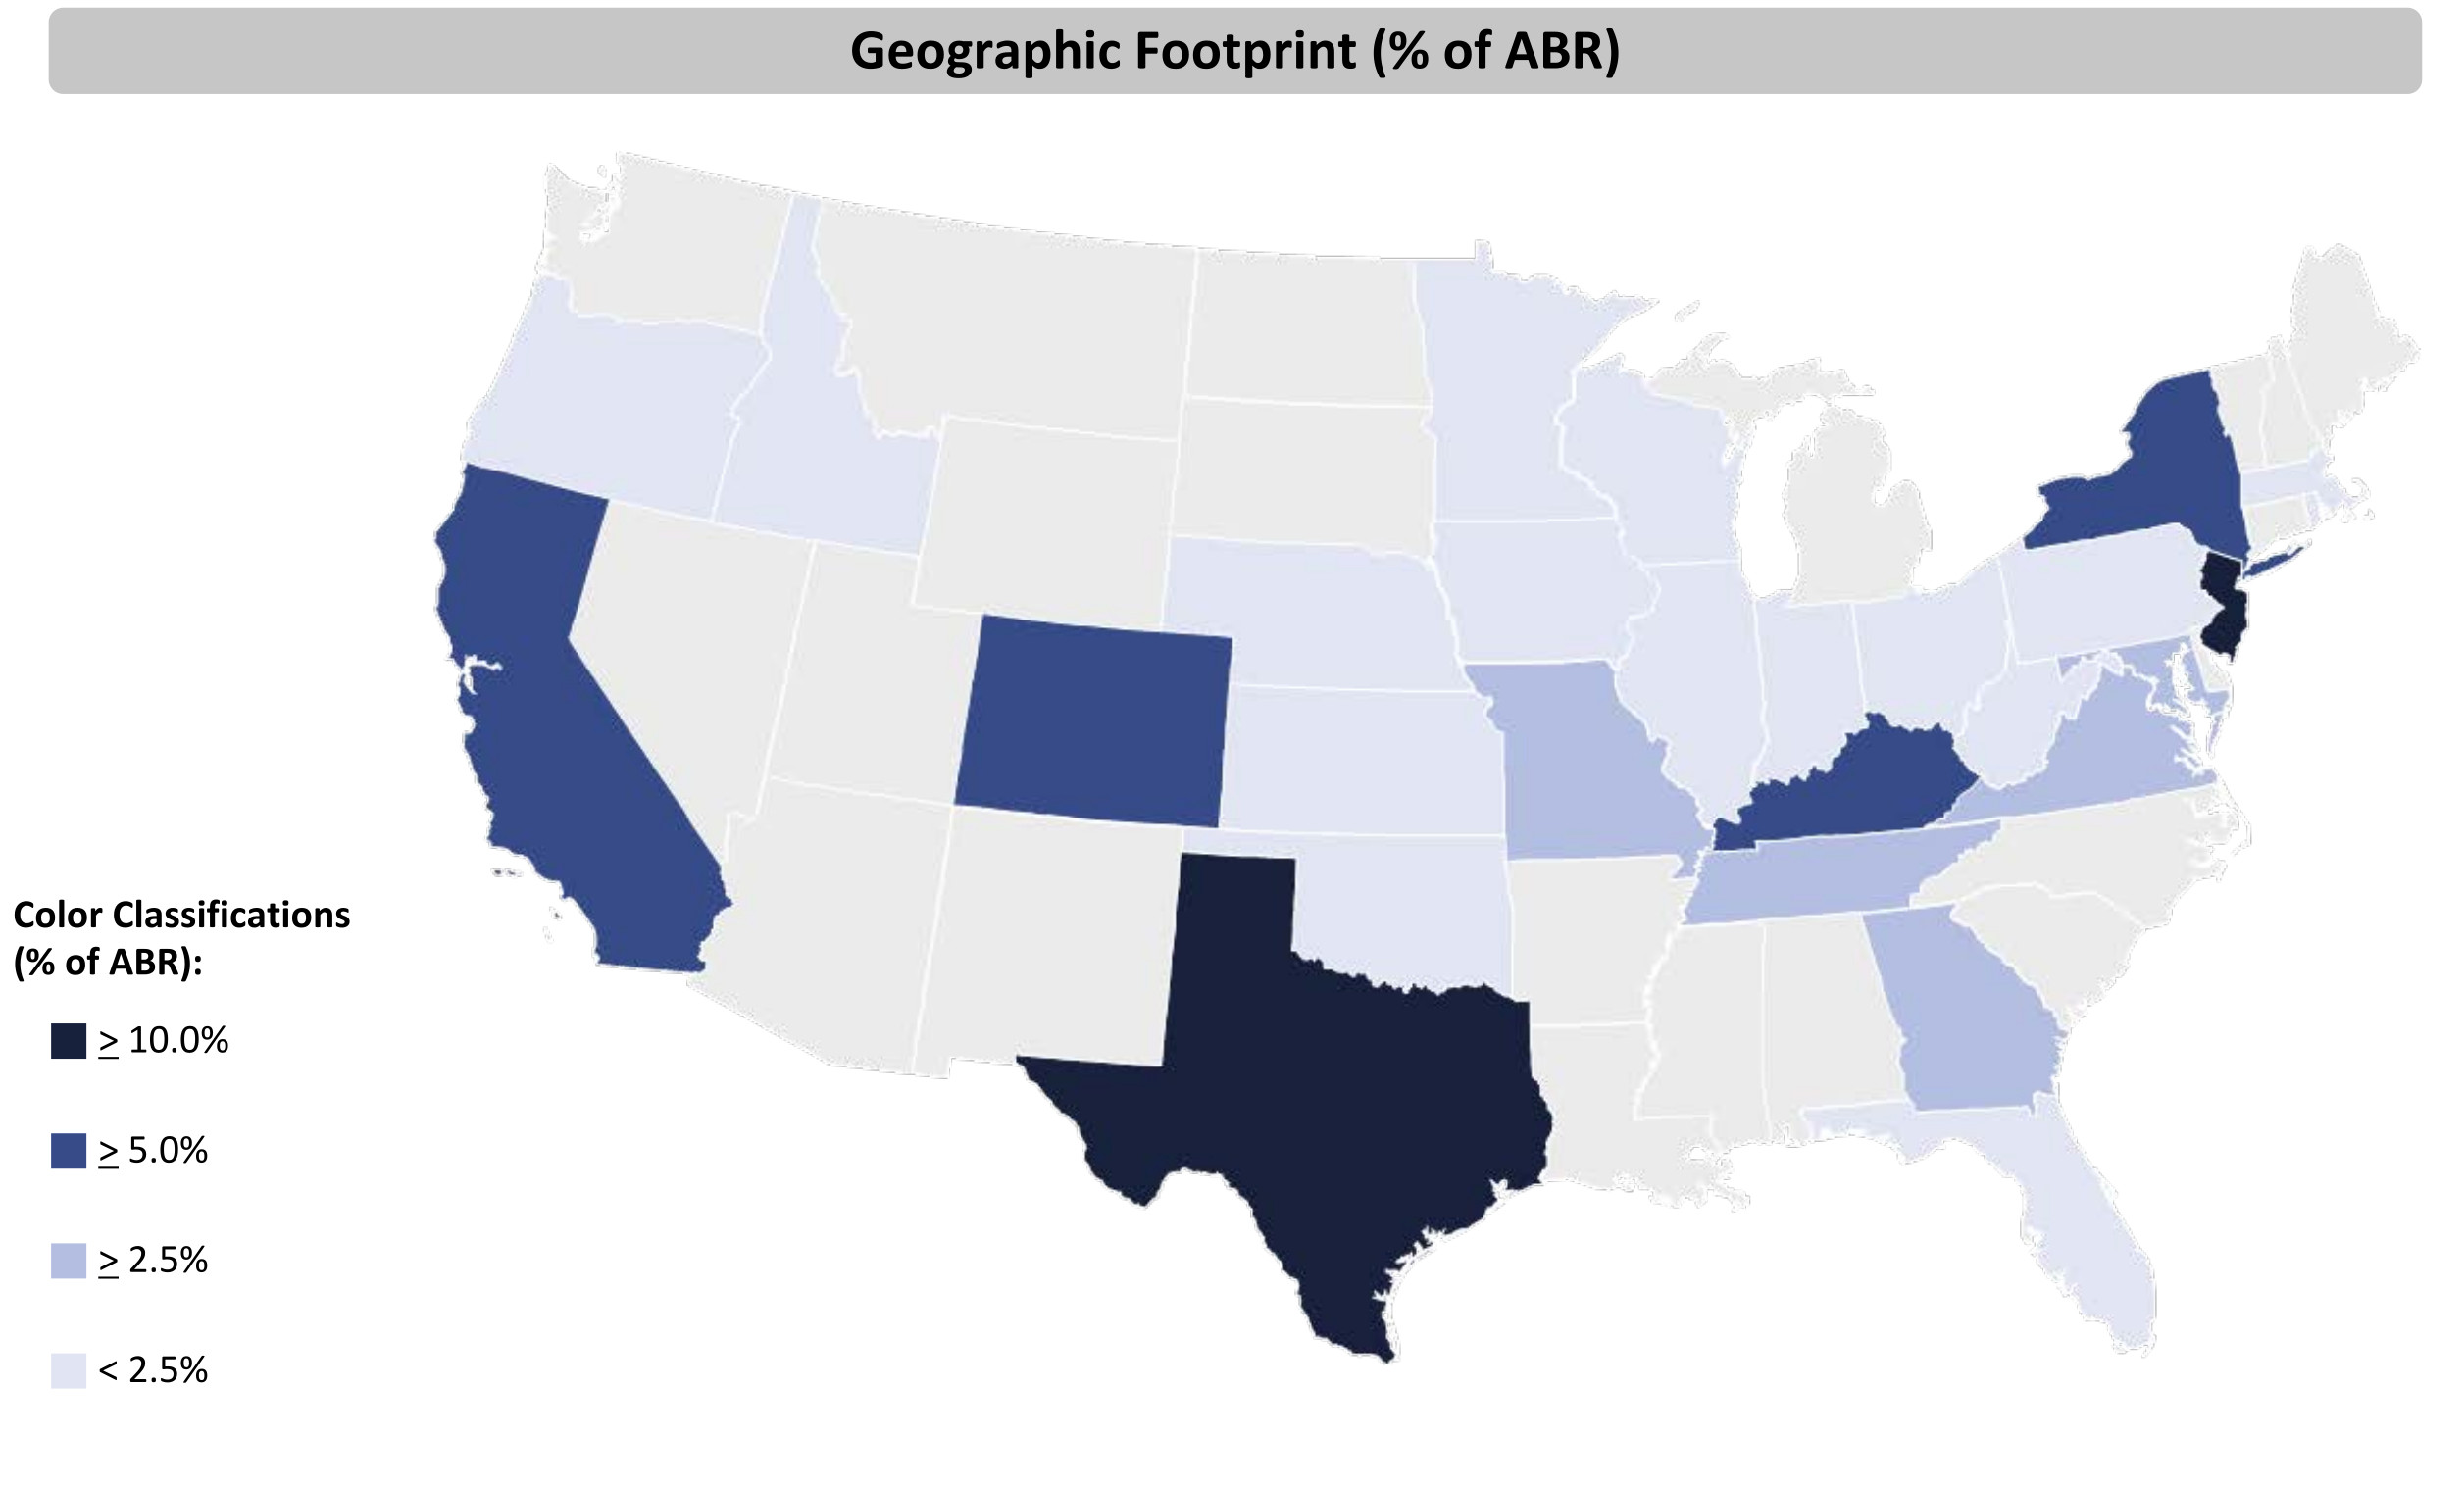
The Orion portfolio consists of 63 wholly-owned Operating Properties and 6 unconsolidated Joint Venture properties, aggregating 7.6 million total leasable square feet with concentrations in high-quality office and specialized-use markets as of September 30, 2025.